1/ Druckenmiller's first mentor, Speros Drelles, would often tell him that "60 million Frenchman can't be wrong."
Here's a thread on what that means and how to know when you should listen to or ignore the "Frenchman" (market)...
The SKEW Index has reached an extreme level.
Over the past 10 years, this has happened only a handful of times. In the last three instances, it preceded significant downside pressure on equities—not immediately, but weeks later.
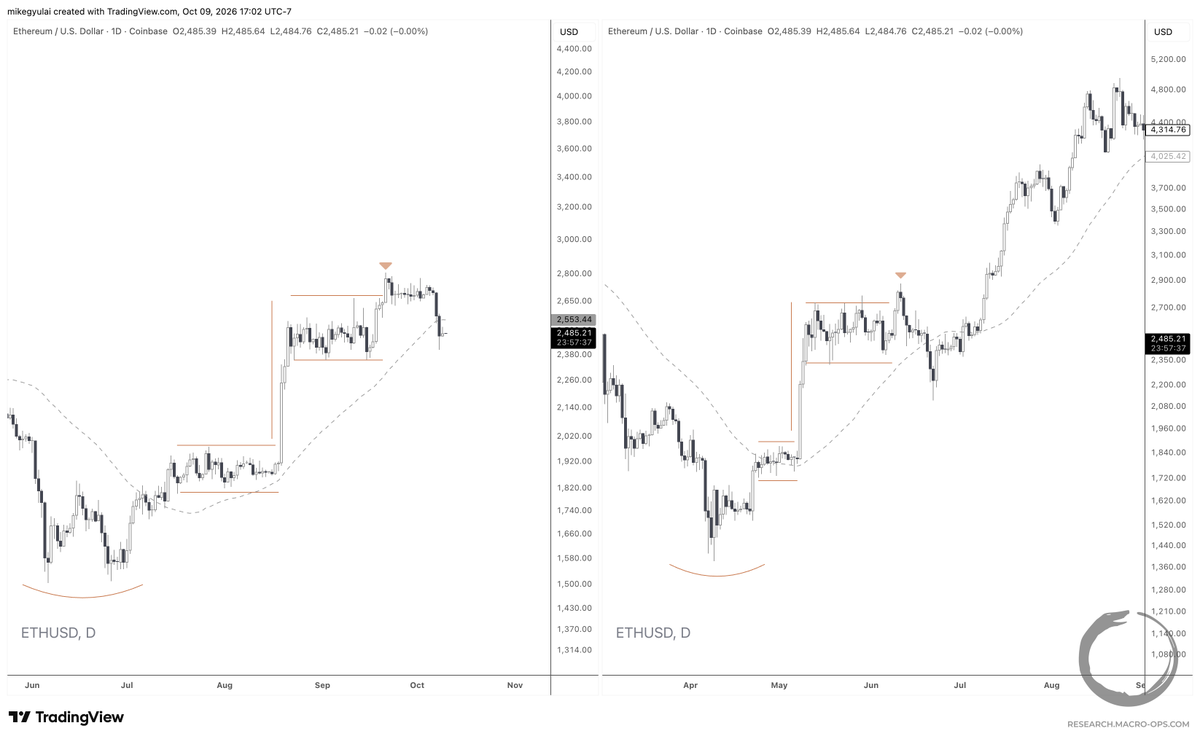
Current price action looks more like 2021. If this analogy holds, we could see a year-end rally before a downturn in January 2027.
*The CBOE SKEW Index measures the perceived tail risk of extreme negative returns in the S&P 500 over the next 30 days, based on the prices of out-of-the-money options (with 100 indicating a normal distribution and higher readings signaling greater demand for crash protection).
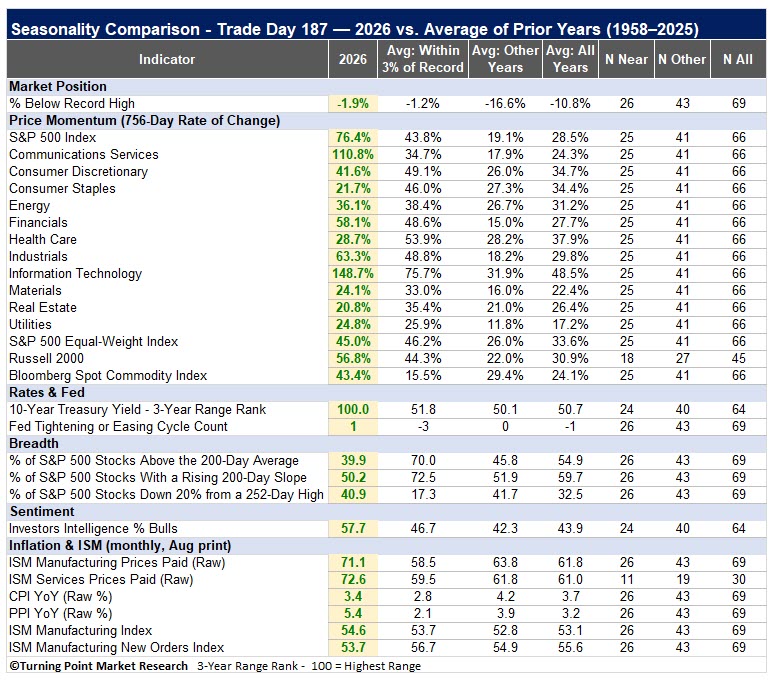
Here’s the midterm election-year scorecard, comparing 2026 with the composite of years when the S&P 500 closed within 3% of a record high on day 188, the seasonal low. Momentum, interest rates, and inflation are all at their most unfavorable levels in the dataset, while market breadth is the weakest on record. But who knows? Maybe the market will deliver the average 17% gain next year after all.
Another notable divergence suggesting caution ahead.
Again, this is not a "sell everything" signal.
However, if confirmed by a bearish technical setup, the odds of a deeper correction increase significantly.
Divergences don't last forever. Something's gotta give.
"Narrow Market Top" setup? Only one bellwether—Financials—has confirmed the S&P 500's latest high; the others still have much ground to make up. That's the same number of red flags as March Y2K. At the 2007 top, all 8 were flashing warnings. At minimum, investors should be uncomfortable. #SP500 #Stocks
There are several notable bearish divergences at the moment, and this one worries me a bit.
Whenever the correlation between the S&P 500 and homebuilders has been this low, equities have experienced significant drawdowns.
The tape remains bullish, so this shouldn't be interpreted as a "sell everything" signal. However, it could be an interesting setup when combined with other technical indicators that confirm a potential short.
A strong negative correlation between a rising SPX and falling XHB can warn of broader equity risk because homebuilders are highly sensitive to interest rates, consumer confidence, and housing demand—key leading indicators of economic health—so sustained weakness there often signals underlying deterioration that the wider market may eventually follow, as seen in pre-crisis divergences.
Worth watching!
When a trader can’t close a losing position, we call it denial. When he can’t take profits on a winning one, we call it greed. The chop in equities has left traders round-tripping their positions, and I’ve heard the same frustration over and over. But neither denial nor greed touches what these traders are actually holding onto.
This week’s essay is about what we’re unwilling to let go of, and why, more than a decade in, I still notice this same tendency in myself.
In markets: the standoff between equities and energy is unresolved. The Nasdaq is holding its breakout while Brent holds the structure of its head-and-shoulders continuation and WTI flags above its breakout level. Feeder cattle recompleted, soybeans are back at their neckline, and soybean oil keeps coiling. In currencies, the Aussie is bouncing off its neckline, the pound is testing the floor of a 15-month triangle for the fourth time, and EUR/AUD is on the verge of breaking down.
Read this week's issue: https://t.co/t3HavTrcJC
One of the big risks of the Iran war many warned about early on was it going regional. It is going VERY regional now and it feels like that fact is being ignored by most.
Not only has the US never televised public executions in its history, but not even the Nazi defendants sentenced to death at the Nuremberg trials had their executions televised (it was deemed violative of the human rights that post-WW2 institutions were trying to re-establish).
The most amazing part of this is that Nidal Hasan is paraplegic and close to 60. So this disgusting spectacle will involve rolling him out in a wheelchair, then live-streaming his body as it's pumped full of bullets.
When I and others pointed out last night that public executions are carried out only by the countries we're told are the most primitive and savage (Afghanistan, North Korea), MAGA enthusisasts replied that we were too weak. Pummeling an old guy in a wheelchair with bullets -- as a reality TV show -- seems like an odd and dubious defintion of "strength," let alone an expression of the western values they endlessly claim they and they alone are trying to salvage.
The S&P 500 has transitioned from its seasonally weak period into the window that has historically delivered the strongest returns. But a comprehensive analysis of momentum, rates, Fed policy, breadth, sentiment, inflation, and economic surveys suggests the backdrop entering this favorable period is anything but normal. In fact, the current combination ranks among the worst setups in history.
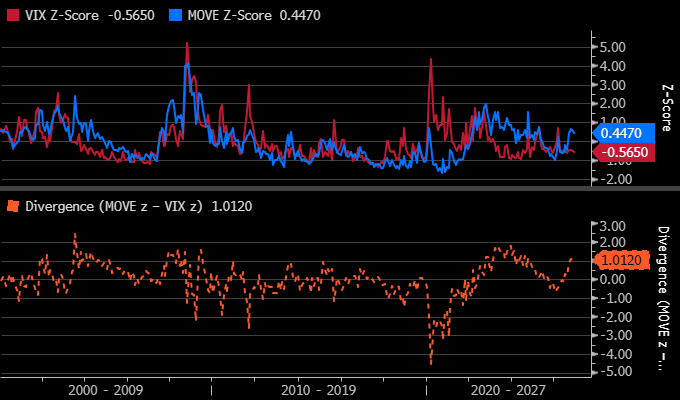
The bond market's fear gauge ($MOVE) has historically provided an early warning when rates volatility rises while equity volatility ($VIX) remains subdued.
Looking back to 2000, I found 12 instances where the #MOVEIndex's z-score rose above +0.5 while #VIX remained below +0.4.
In these 12 instances:
- #VIX moved higher within 1-3 months in 10 of 12 cases (83%)
- The #SPX was lower 3 months later in 9 of 12 cases (75%)
The two false signals are worth noting:
- 2003: A bond market "tantrum" drove Treasury volatility sharply higher, but the S&P 500 was emerging from the post-dot-com bear market and continued to recover.
- 2009: Sovereign debt concerns pushed rates volatility higher, but QE and extraordinarily accommodative Fed policy helped suppress equity volatility and support risk assets.
Today:
- MOVE z-score: +0.45 (after just reaching +0.5)
- VIX z-score: -0.57
- MOVE-VIX spread: +1.01
That means the historical early-warning condition is present and the divergence has widened to levels seen during prior MOVE-leading episodes. However, the strongest historical condition has not yet been reached.
In this study, the strongest signal occurred when MOVE's z-score exceeded +1.0 while VIX remained below +0.4. Every occurrence of that setup was followed by VIX moving higher and the S&P 500 posting negative returns over the next 1-3 months.
Could be worth watching.
*Past performance is no guarantee of future results - signals can fail
*Schwab does not recommend the use of technical analysis as a sole means of investment research
*All names and market data shown below are for illustrative purposes only and are not a recommendation, offer to sell, or a solicitation of an offer to buy any security
*Chart source: Bloomberg
Individual stock drawdown is something @michaeljburry wrote about recently and is a chart I've shared a couple of times as well. Despite the new 52-week high in the S&P 500, more than 75% of stocks are down double digits. and over 37% are down 20% or more.
If SpaceX ($SPCX) was in the $SPX now, AI-related stocks would be 51% of the index.
With Anthropic and OpenAI coming public, add them to the $SPX in 2027 and AI would be ~55% of the $SPX.
The last time a single theme was >50% of the $SPX was the railroads in the 19th century.