Continued some research on measuring how well individual soccer players play defense. Last time it was in open-play phases, and this time I tried to allocate defensive value on set piece plays:
https://t.co/hqS4JC5ePq
Today, the Players are proud to announce the creation of the Om Arvind Gift in honor of the life & legacy of soccer journalist and women’s soccer advocate Om Arvind.
Read more at ⬇️
https://t.co/y3P8YkERmA
If you are actually looking for metrics to complement xGD in team predictions, consider other flavors of EPV metrics. Something like the average of the maximum EPV in each possession, or the average starting EPV of each possession.
Mostly I want to make the point that xG and EPV type metrics are doing the same thing/ using a similar framework (goal probability) just at a different level of accounting. It’s why that 2008 @soccermetrics post imagines “an expected goal value” broadly defined (not just shots)
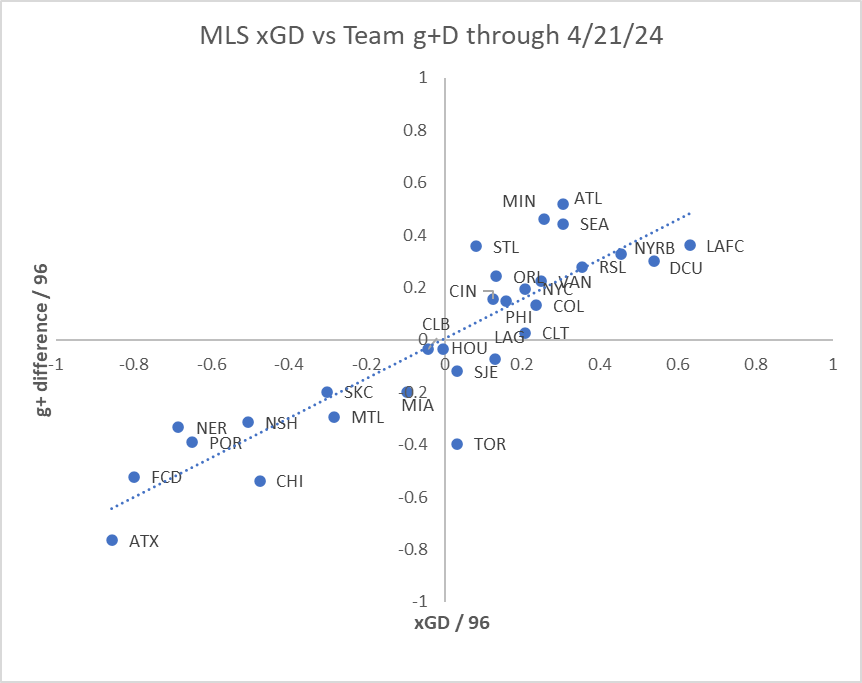
I was able to explain nearly 90% of the difference between xGD and g+Diff (i.e. R2 = 0.9) with these two things:
1. How much passing value is lost to imaginary receivers on incomplete passes.
2. That g+ is built on a two-possession outlook, rather than just current possession.
hey @AnalysisEvolved, remind me what would be the major sources of difference above or below this trend line for team g+ diff vs xGD?
Each dribble/pass turnover hands EPV over to the other team via interrupting g+ right? Is it just the mix of dead ball vs open play turnovers?
@Stat_Ron@DW__Analytics @jaseziv @AnalysisEvolved You can get a lot of ASA stuff with the itscalledsoccer packages!
Python: https://t.co/PrU0VwMrhV
R: https://t.co/LFKAcopxLV
@VictorPontes070@STLCinderace@AnalysisEvolved g+ has been calculated before on European leagues, though it is not published. Between about 2015-2022, I believe Messi had 5 of the top 10 seasons. Ronaldo had one or two seasons in the top 10 over that time period.
A new year means a new playoff format . With a bigger emphasis on penalties this season, knowing which clubs have the best takers could be more important than ever. @etmckinley has you covered.
https://t.co/r1JDPkdZTK
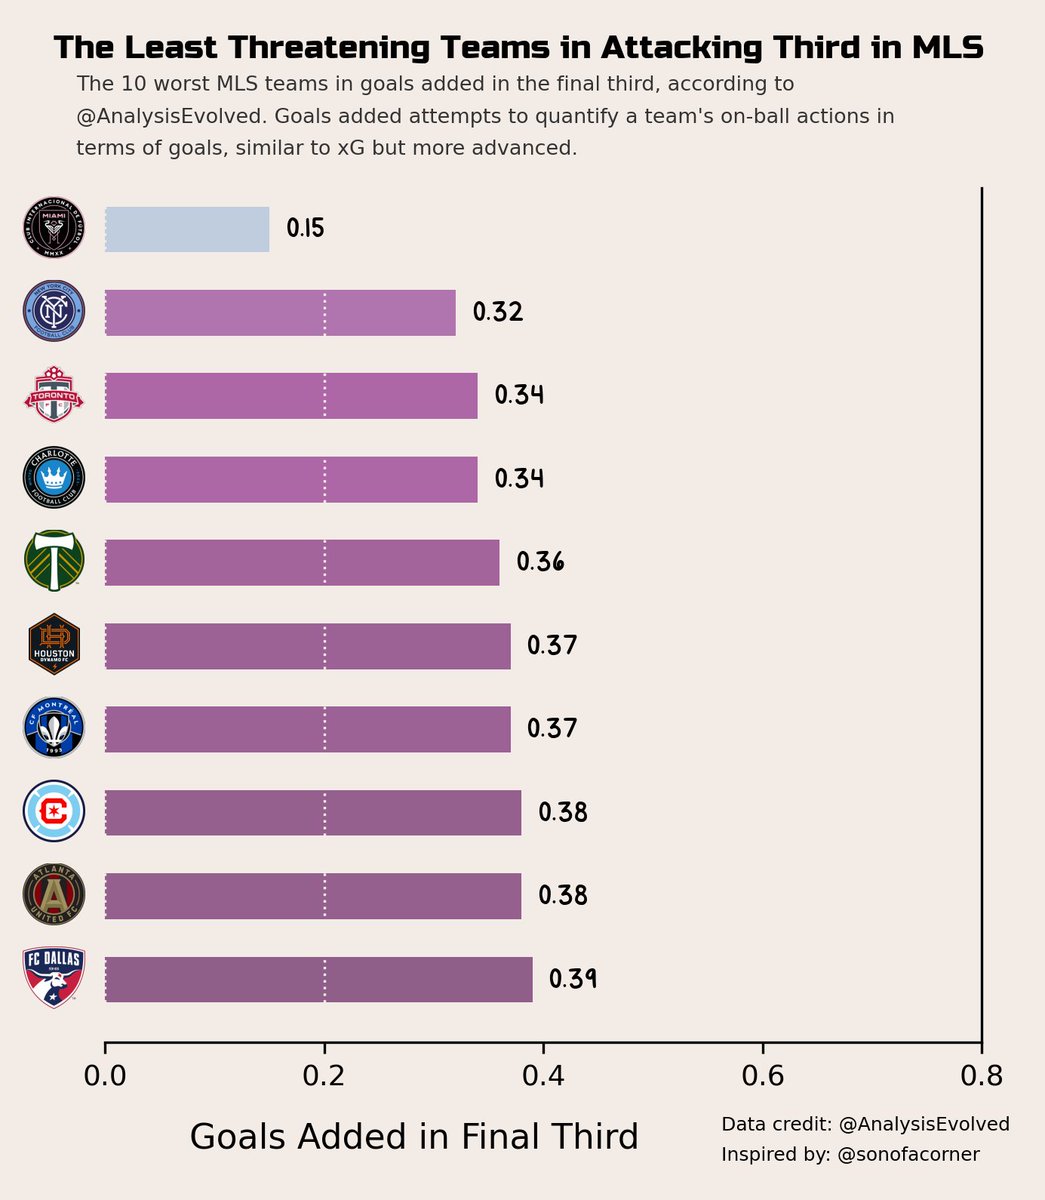
@STLCinderace@AnalysisEvolved Here's what model sees:
* STL lineup has players with historically bad g+
* As a team, STL has produced below-average g+ and xG diffs
Check out numbers here: https://t.co/rosIt5biaC
@colinalber10@AnalysisEvolved Note that Western Conf teams are extremely likely to go on the road for the final, based on total points, and all their conditional cup final probabilities are thus <50% because of the huge home-field advantage we've observed in MLS for years. (e.g. STL is 4/13 to win cup final).
@HellbenderSTL@AnalysisEvolved 2 is definitely arbitrary, just trying to automatically capture likely lineups. To clarify, the player g+ itself averages the player's entire history in our database, with more weight to recent games. 2-game cutoff is just for determining likely lineup.
Decision Day is nearly here!
@MattyAnselmo simulated MLS playoff outcome probabilities based on the new playoff format & the strength of teams, as measured by both team-level metrics and player-level metrics according to the best combined lineup of each team's last two games.
Tomorrow is the big day. Before the World Cup starts, @EvanDavisSports wrote about the the best NWSL players to never make a World Cup roster.
https://t.co/Aq2AJAZzuu
𝑻𝒉𝒂𝒏𝒌 𝒚𝒐𝒖!
All of our subscription revenue from June is headed to TOPSoccer, a program for children with disabilities!
We raised enough money to help purchase new equipment for local TOPSoccer clubs.
Read more ⤵️
https://t.co/tbuMmsy3Je
@AnalysisEvolved@bbmikej Back of the envelope: typical MLS club scores like 1.5 goals per game. In predictive models, 60% of a team’s g+ over average is stable to future games. So if that 3.56 is like 2g+ over average, then this team would be predicted to score about 1.5+0.6x2=2.7 goals per game.