CloudCast is now in open beta.
Why settle for another ordinary weather app when you could be among the first to experience something different?
Download CloudCast today and get early access.
https://t.co/avqbahpG2e
CloudCast is pending Apple review, will share the link as soon as it’s live but before then, some FAQ’s!
❓Will there be an Android version?
YES! Not initially, but I will begin working on an Android version early next year, I hope to have it ready for testing by the end of February.
❓Is the app free?
Yes, many of the apps features & charts are free, all of the features you’d expect from a typical weather app are free.
❓Is there a Pro version?
Yes, CloudCast Pro will unlock more features and more “Pro” level charts such as MOGREPS ensembles, MJO forecasts, Stratosphere Vortex forecasts and a few other “nice to have” features too.
❓How much will CloudCast Pro cost?
£3.99 a month with yearly and lifetime subscriptions coming soon. The aim isn’t to make loads of money, but to cover server costs only.
❓ Will there be ads?
No. Absolutely not. Never. Ads in apps are yuck.
❓ Why did you make CloudCast?
As someone who loves weather, I’ve grown increasingly frustrated with the lack of weather model viewers inside apps and that most weather model sites were designed in the early 2000’s and are typically poorly optimised for phone use.
The recent Met Office app re-design really drove the decision to do this, from the warnings interface to, well, the entire design, it just doesn’t resonate or in my eyes, clearly communicate the weather in a way that doesn’t require cognitive load.
I wanted to create an app that not only presents weather in a different way (Alternative predictions), but can be an app where anyone from my nan to a meteorologist can gain an understanding of the weather, from simple hourly view weather right up to analysing the stratosphere, all in the same app.
I’ve built the app I’ve always wanted as a weather enthusiast. When I installed the app on my nans phone and watched her using it, I knew I might have something here because she was just browsing through it with no real problems, this is a lady that up until last year didn’t know what a smartphone was! 😂
I’ve been using CloudCast as my primary weather app for a couple of months while developing it and I love it, I hope you’ll feel the same way about it too.
Thanks to everyone who has (and continues) to provide feedback, you have helped shape and develop this app as much as I have.
@JuliusSubovic That’s a risk regardless of what method you use for long range forecasting.
The GSDM is the best we have for diagnosing global weather patterns at sub-seasonal ranges.
Up.. up and away.
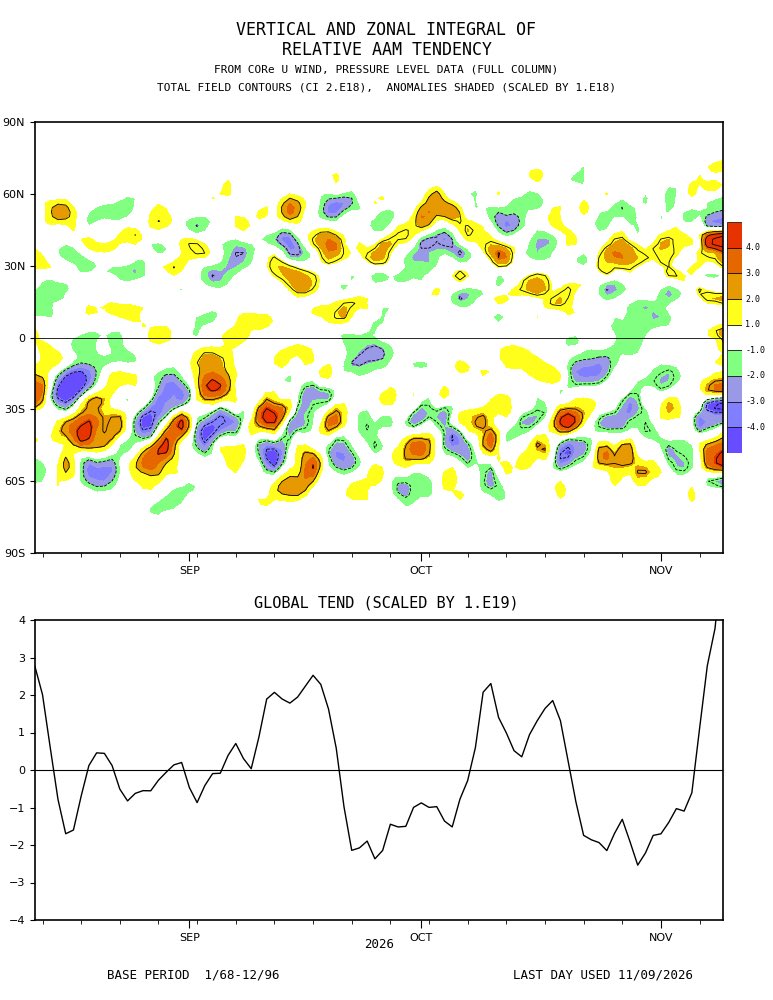
Huge injection of momentum into the Pacific jet at the moment courtesy of an off the charts East Asian Mountain Torque event.
This will lead to an incredibly strong Pacific jet stream but equally, this will cause undulations and waves to form as the jet moves eastwards into America and interacts with the Rockie mountains, enhancing those waves, ultimately leading to an anticyclonic wave breaking event in the Atlantic or towards Scandinavia.
The MJO continues to sit in phase 2 (Indian Ocean) increasing in amplitude with expectation of eastward progression into phase 3 by mid November.
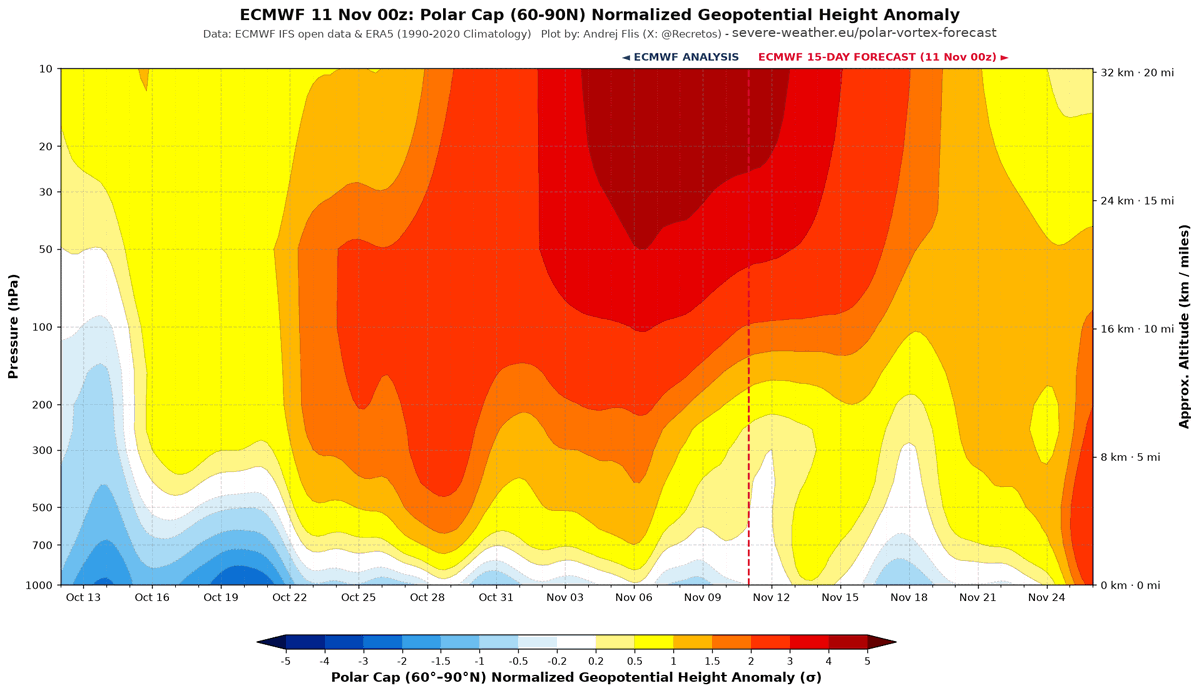
A major SSW with u-wind reversal in the stratosphere takes place in the next 2-3 days with modelling predicting these negative anomalies will “drip” down into the troposphere late November into early December.
What does this actually mean?
INCREASED LIKELIHOOD OF BLOCKING and cold weather outbreaks through the first two weeks of December with high latitude blocking perhaps developing across Scandinavia initially before retrogressing west towards Greenland as we see a sharp correction of the AAM to negative tendency once this +EAMT event wanes, I.e the signal for a retrogressive pattern.
Potential beyond that (Mid December onwards) for a return to unsettled, Atlantic driven weather given sharply declining AAM tendency combined with a rebounding stratospheric vortex.
I’ve submitted the first version of my app to the App Store, it’ll hopefully be available to everyone in a couple of days.
- Beautiful weather animations and designed to give you all the information you need, without overwhelming. Wind gusts are easily findable..
- Radar with satellite, MSLP & warnings overlay, going back 4 hours, or 24hrs for Pro users.
- When is the best time to.. go for a walk or hang your washing out?
- Snow line will tell you at a glance where the freezing level is and whether your altitude is likely to see snow.
And.. more 👇🏻
Thursday night will the coldest night of the season for many areas with temperatures widely at or below freezing 🥶
Widespread frost expected Friday morning so get the scrapers ready!
I’ve submitted the first version of my app to the App Store, it’ll hopefully be available to everyone in a couple of days.
- Beautiful weather animations and designed to give you all the information you need, without overwhelming. Wind gusts are easily findable..
- Radar with satellite, MSLP & warnings overlay, going back 4 hours, or 24hrs for Pro users.
- When is the best time to.. go for a walk or hang your washing out?
- Snow line will tell you at a glance where the freezing level is and whether your altitude is likely to see snow.
And.. more 👇🏻
Apple weather uses standard GFS data from what I know, my app uses a combination of high resolution UKV & MOGREPS ensemble data to give a *most likely* forecast but also a range of possible outcomes.
I.e a high of 14C might be the most likely high, but that doesn’t mean 13C or 15C won’t be the high, the weather is rarely deterministic.
GFS 6Z shows a typical, case study positive East Asia Mountain Torque early november, ending up with a stronger, more compact NPAC Jet-Stream initiating a +NAMT when colliding against🇺🇸mountains, initiating meridian flows propagating downstream into Atlantic few days later🧵/18
@gundaaaaaaaaaa Definitely plan to expand to Europe, the back end already allows for European forecasts, I would just need to add more European chart views AROME, for example.
The radar might be the biggest technical point to resolve.
Let's learn No. 3: Atmospheric Angular Momentum (AAM)
The AAM is a very complicated topic & an area of science that is relatively new in terms of research and understanding. I'll try my best to explain the broader outline as simply as I can, but please feel free to ask questions!
The AAM forms part of the Global Synoptic Diagnostic Model (GSDM), a model designed to apply a diagnostic approach to medium range weather forecasting, whilst it can't tell you specific weather on specific days it's instrumental in predicting broad-scale weather patterns in the 2-3 week range & sometimes a little beyond that.
Today, i'll focus solely on the AAM. Atmospheric angular momentum (AAM) is a measure of how fast the atmosphere rotates around the Earth's axis.
A faster atmospheric rotation = a positive AAM, a slower atmospheric rotation = negative AAM. It's essentially a measurement of momentum within the atmosphere when averaged across the globe.
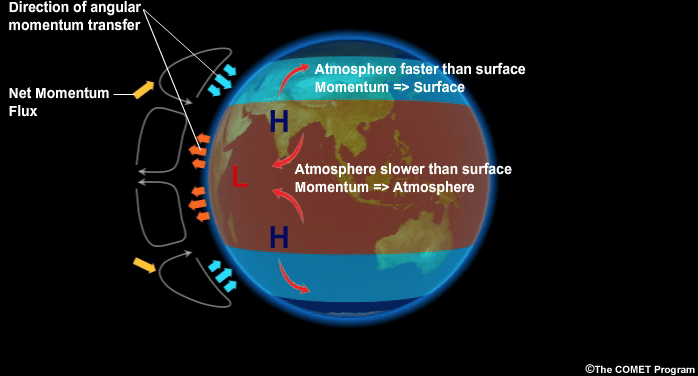
Various weather events can either add or remove westerly momentum from the atmosphere and the MJO (previously discussed) is a big player in this, when the MJO progresses eastwards through the Maritime Continent frictional torque generated against earths surface acts to slow down earths rotation, energy must be conserved however so this momentum transfers into the atmosphere and the result is we see an increase in atmospheric momentum.
The largest player in adding or removing momentum however is mountain torque. During a positive mountain torque event, large mountain ranges are "bumping" into areas of higher pressure, this slows down earths rotation and that transfers momentum into the atmosphere. (please see linked tweet thread in the reply to this for a more detailed explanation on mountain torque) Mountain torque always proceeds frictional torque.
The opposite to the above is also true, the MJO returning to the Indian Ocean sees a return to negative frictional torque with negative mountain torque following, this does the opposite to a positive event and removes westerly momentum, transferring that momentum back into earths rotation and out of the atmosphere.
During La Nina, AAM is typically negative due to an increase in the easterly trade winds across the Pacific (less westerly momentum), the opposite is true for El Nino, weaker easterly trade winds tend to produce positive AAM.
You can however see positive AAM during La Nina, or negative AAM during El Nino, these are often called "mini ENSO cycles" and are more broadly driven by the MJO.
Complicated. How does this tie into weather patterns?
A very rough rule of thumb is that a positive AAM (increased westerlies) tends to produce a more wavey/amplified jet stream which increases areas of blocking high pressure in the mid/high latitudes, a negative AAM does the opposite and produces a flatter, more zonal jet stream.
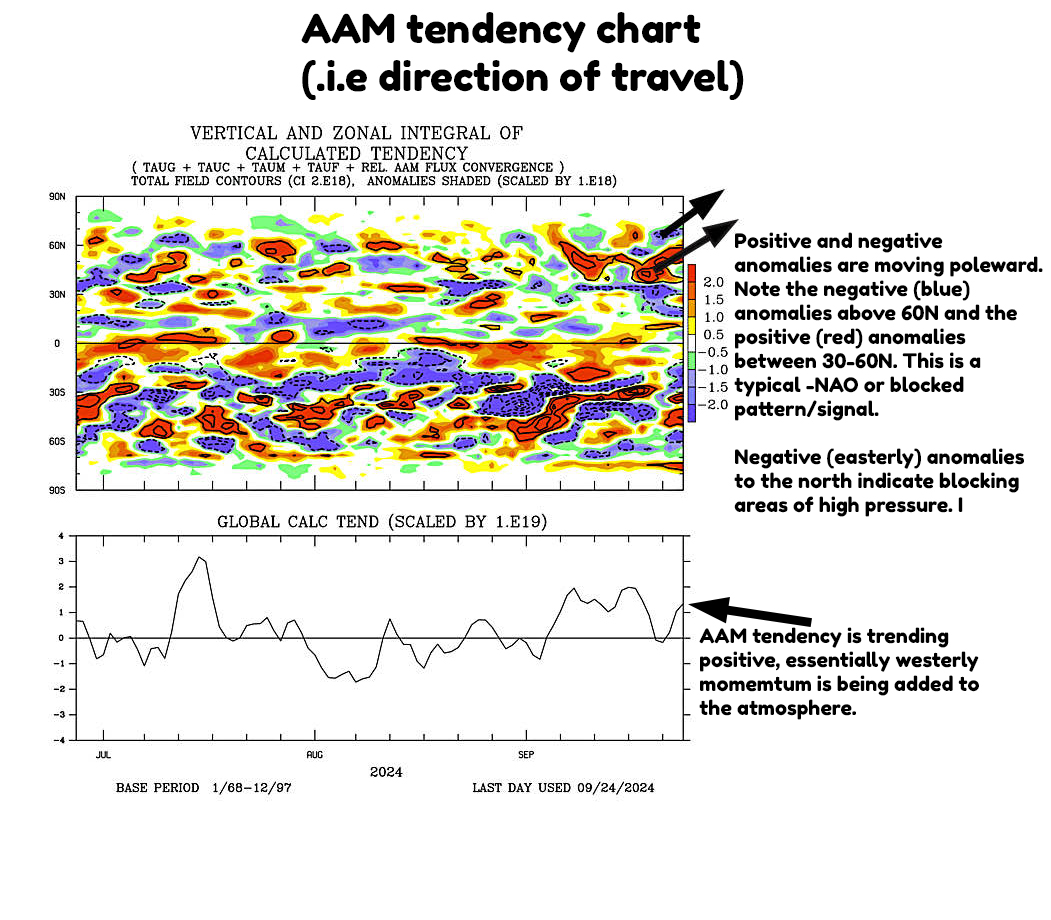
The direction of travel is often more important than the total. For example; total AAM could be negative but certain events are adding westerly momentum to that atmosphere & thus AAM tendency (direction of travel) is positive.
You also need to account for "where" those positive or negative anomalies are heading. Are they moving towards the equator? In which case this tends to enhance sub-tropical highs and we see a stronger Azores high and often milder weather, or are those anomalies moving towards the poles? In which case blocking in the higher latitudes is more likely. I've annotated the AAM tendency chart (2nd image) to try and show this.
You also need to account for phasing of the MJO, does this align with the current direction of travel with the AAM? For example; let's say the MJO is in phase 6, this typically correlates to high latitude blocking, but AAM anomalies are moving towards the equator, this goes against the idea of high latitude blocking.
Two opposing signals make the medium range forecast more uncertain. Looking at the MJO alone, you'd expect blocked patterns but the AAM is telling a different story, this is why it's important not to take the MJO in isolation.
When both of these drivers are in alignment however, you can be far more confident in the medium range forecasting space in terms of the broader pattern, often being able to flag the potential for "high impact weather" far earlier, albeit on a broader scale, specific details of when/where/how bad will always be reserved for shorter range forecasting & models.
I hope this explanation makes at least some sense & explains why AAM plays an important role in medium range forecasting. Any questions please feel free to ask.
Next time: Frictional Torque & Mountain Torque.
Lets learn No. 2: Stratospheric Polar Vortex & Why It's Important
The stratospheric polar vortex (sPV) forms during the autumn as the Arctic cools increasing the thermal gradient between the Arctic and the equator. Winds in the stratosphere move in a westerly direction and can be a key driver of weather patterns.
A strong sPV can help to increase the strength of the jet stream lower down in the troposphere leading to milder, stormier weather, conversely, a weaker polar vortex can lead to a more sluggish jet stream allowing for blocked/colder patterns to develop.
Strong sPV's can override tropospheric patterns and can really drive the weather across the northern hemisphere.
October & November are often key developmental months for the sPV and many meteorologists/weather enthusiasts watch as this could give early signs of what type of winter we're going to have.
Occasionally, something known as a "Sudden Stratospheric Warming" (SSW) can take place, when this occurs temperatures in the stratosphere can rise by 60-70C in the space of just a few days, this can cause a weakening of the sPV and even cause the westerly winds to reverse to easterly temporarily.
When this happens, those easterly winds can propagate downwards into the troposphere weakening the usual westerly winds leading to periods of blocking in the mid/high latitudes. The BFTE in 2018 was a result of an SSW although this was one of the most extreme events on record, around 70% of SSW's that result in a full reversal (westerlies reversing to easterlies) produce cold weather outbreaks into the mid latitudes during winter.
SSW's occur on average once every 2 years and can be one of the most dramatic weather events on earth, predicting when these will happen though is quite difficult with lead times generally in the 1-2 week range.
Cold/snow lovers want to see a weaker vortex in general during winter as this increases the chance of blocked weather patterns being able to develop.
This is a very basic overview of the stratospheric polar vortex and why it's talked about so much during the autumn/winter season.
Next time: Atmospheric Angular Momentum
Lets learn No. 1: What is the Madden-Julian Oscillation (MJO)?
You'll likely see me refer to MJO a lot in the coming months, it's a very important intra-seasonal driver of global weather patterns and can often give a clue to the longer-term forecast.
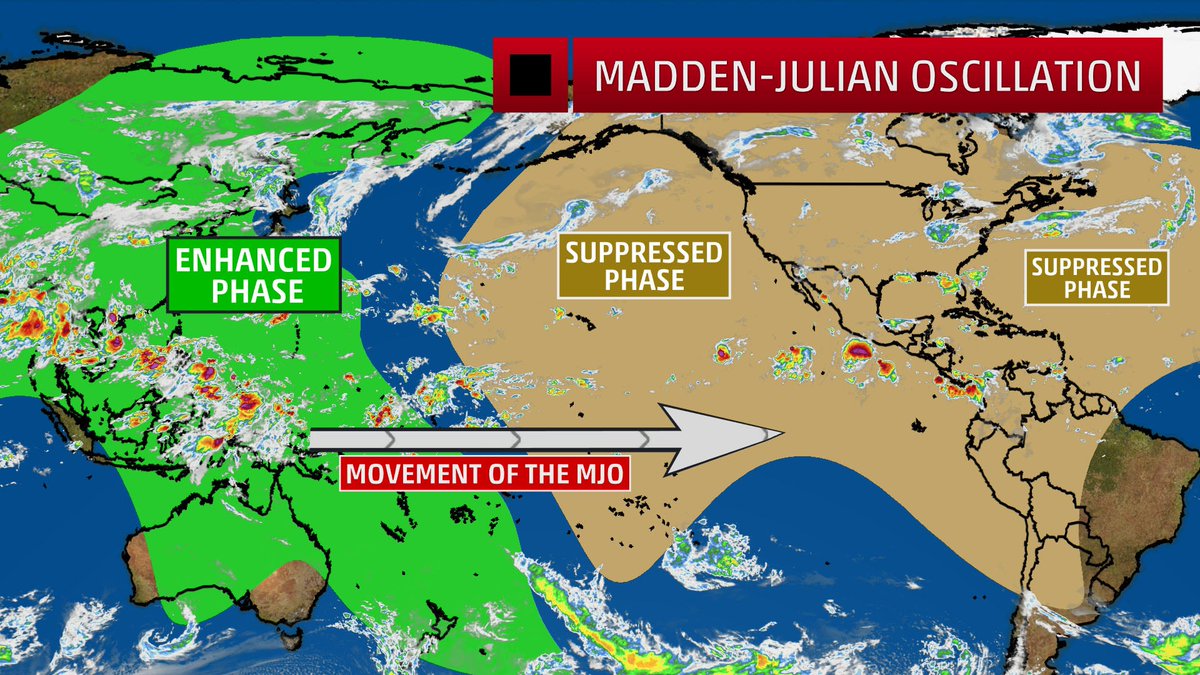
In essence & without over-complicating things, the MJO is an area of enhanced convection that moves eastwards along the equator in a cyclical cycle of about 30-60 days.
This area of enhanced convection begins in the Indian Ocean and moves eastwards through the Maritime continent, into the west Pacific and onwards through the central Pacific, east Pacific and then into the western tropical Atlantic before "resetting" back to the Indian Ocean.
One way to track the MJO is using space-phase diagrams (2nd image). The further away from the centre of the diagram, the stronger or more amplified the convection. The stronger the convection, the more impact the cycle can have on global patterns.
When the MJO resides inside the centre circle, this essentially suggests there is no signal, i.e there is no discernible convection, whilst not always true as these plots can be deceiving, I wont go into the complexities of why here.
Each phase of the MJO corresponds to the location of that enhanced area of convection. Phase 2-3 are the Indian Ocean, 4-5 the Maritime continent, 6-7 the western Pacific and 8-1 the tropical Atlantic/Africa.
The location is important as this determines where the MJO begins to influence the jet stream, this has downstream impacts on weather patterns in terms of positioning of high/low pressure patterns.
The MJO has far reaching impacts, it can increase or decrease tropical cyclone/hurricane activity and plays a very important role in the Australian monsoon season.
The MJO cannot be used in isolation and it's not quite as simple as saying "Phase X = X type of weather", but it's one of the most important drivers of weather patterns.
For those looking for colder weather, a general rule of thumb is that we want to see an amplified signal move through the Maritime continent (phase 5-6), into the western Pacific (6-7) and into phase 8-1, this more broadly speaking promotes blocking patterns in the Atlantic/over Greenland during the winter months.
This isn't the entire story and the progression east of the MJO triggers other events which impact weather patterns too and these also need to be factored into the broader picture to form a diagnostic view of possible future outcomes. (i'll go more into these in the next "Lets learn".
Rule of thumb:
Phase 3-4 = +ve NAO, i.e unsettled, mild
Phase 6-7 = -ve NAO, i.e blocked, colder, drier
Next time: Stratospheric Polar Vortex (sPV)
The polar vortex is an area of westerly winds in the Stratisphere above the Arctic, it forms every autumn as the temperature contrast between the Arctic & Equator increases.
Through late winter / spring, the decreasing thermal gradient causes the vortex to weaken and eventually for winds to reverse to easterly, I.e no more vortex.
But, we can someone’s see sudden warming events in the middle of winter which can cause those winds to reverse and the vortex to temporarily break down, when this happens it can increase the chances of cold weather outbreaks into the middle latitudes, I.e America, Europe, Asia
Well..
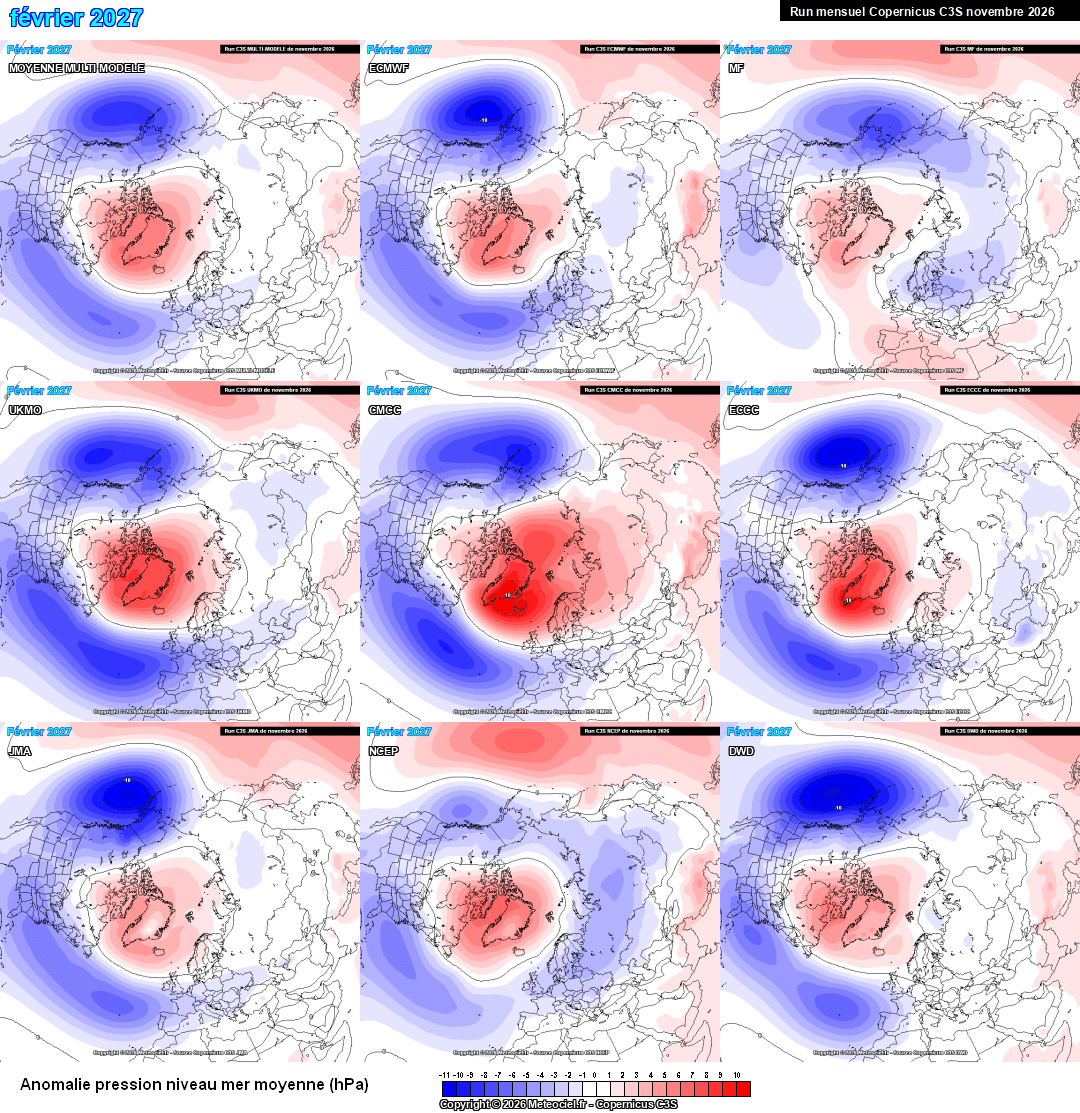
Virtually every single seasonal model for this winter shows blocking throughout December, January & February with the trend in blocking strengthening as the winter progresses.
In all my time of weather watching I've never seen such a strong and collective signal for a potentially very cold winter.
We do have to be cautious, though. They are all going off the same long term drivers and given the current unprecedented nature of this El Nino event, we have no real way of knowing whether or not this is a real model signal, although it sure looks like one.
@WxMaccaUK@arnau1700 Do have to be cautious though - There was an almost equally strong signal for an unsettled November > December, that evidently hasn’t come to fruition!
The final third of November is proving a tricky one for forecasting in the N. Hemisphere.
Recent forecast modelling wasn't very interested in the near-term major sudden stratospheric warming event having much influence on surface weather patterns... until the past day or two.