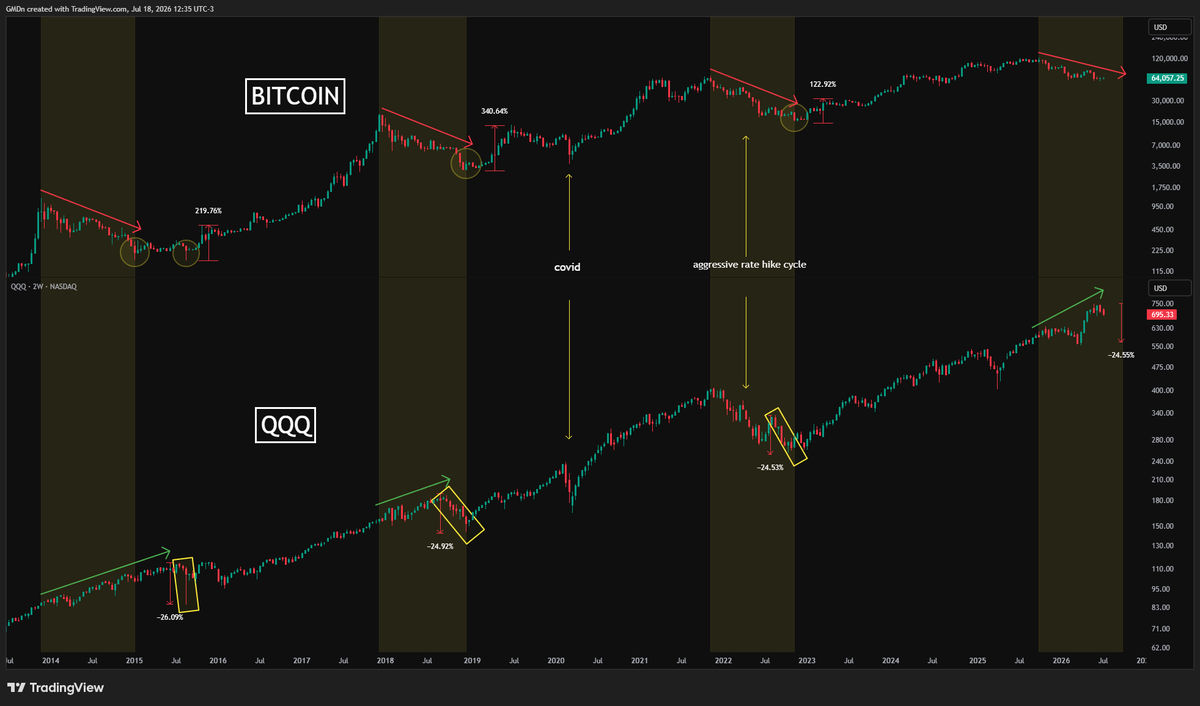
Looking at this #Bitcoin and $QQQ comparison makes me think about all the new retail investors who bought BTC near the top of this cycle and still cannot understand how equities have been skyrocketing while Bitcoin keeps trending lower.
At this point, it is clear to me that Bitcoin is its own asset class, and it will do whatever it has to do regardless of the broader market context.
As you can see, it is normal for BTC to go through its cyclical bear market while equities continue moving higher. The one exception was the 2022 bear market, when equities also declined for an extended period after the Fed began an aggressive rate-hiking cycle.
One of the most reliable correlations for $BTC so far has been the global liquidity cycle.
In my opinion, no one is better than Michael Howell when it comes to this type of research, and he has been remarkably accurate for a long time.
He does not call exact tops or bottoms, but he is very good at identifying periods when global liquidity is increasing or decreasing.
These cycles tend to last approximately four years.
He describes rising liquidity as a tide that can lift all boats at the same time, while declining liquidity is more selective and only lifts a few.
His current research suggests that global liquidity is still declining, but could enter a bottoming process during Q4 2026 or Q1 2027.
What is interesting about this chart is that, during the final stages of liquidity bottoming, we also tend to see a sharp pullback in the US stock market.
At this point in the cycle, it is impossible to ignore the many alarming signals at both the macro and geopolitical levels:
the conflict in the Middle East causing oil price spikes, $DXY strengthening while the yen weakens and increases the risk of another carry-trade unwind, and US long-term yields looking ready to move sharply higher as uncertainty continues to build.
Meanwhile, stock market dispersion and implied correlation remain at extreme levels, suggesting that a sharp move could happen at any time.
I think we can agree that BTC is beginning to show some early signs of a bottoming process.
After all, we are supposedly around 2.5 months away from the cycle bottom date.
But if the US stock market experiences a sharp pullback, I believe Bitcoin could finally be dragged down with it, creating that one final sell-off that marks the cycle bottom.
Or perhaps this time is different...
We shall see.
The current Bitcoin bear market has been more tame than the last 3 bear markets that started at the end of post-halving years.
The reason it feels worse is that there was not a euphoria phase (so the price at which the bear market started was lower than what many expected)
Gold is oversold and gold bulls are pumping the resumption of the bull market.
They may be right.
Or not.
There are 220kt of available gold and mines produce ~3700tpa and ~1300tpa of gold is recycled.
At $4000 this is a market of ~$28tn.
At $5000 its ~$35tn
At $10,000 its ~$70tn.
At end 2024 it was ~$17tn so today there is ~$11tn of value increase for 2024 gold holders and in January 2026 there was ~$21tn `profit' sitting on the table.
The biggest gain ever in any single market.
What is the psychology of those holders, especially those who missed selling at the highs and locking in big gains and also those in weak currencies?
Will they be the ones to sell into the rallies?
Or will it be those latecomers in the ETFs who bought in high volumes near or at the top?
The last stages of that parabolic move were clearly market madness to experienced market professionals.
Parabolic peaks are indeed parabolic PEAKS and usually consume enormous market energy and also funds.
And usually show long periods of consolidation afterwards.
The Dec-Jan period was full of hucksters and charlatans bulling up the market to make that frenzied peak.
Look at every major previous peak in gold. Parabolic rises that took years afterwards to consolidate.
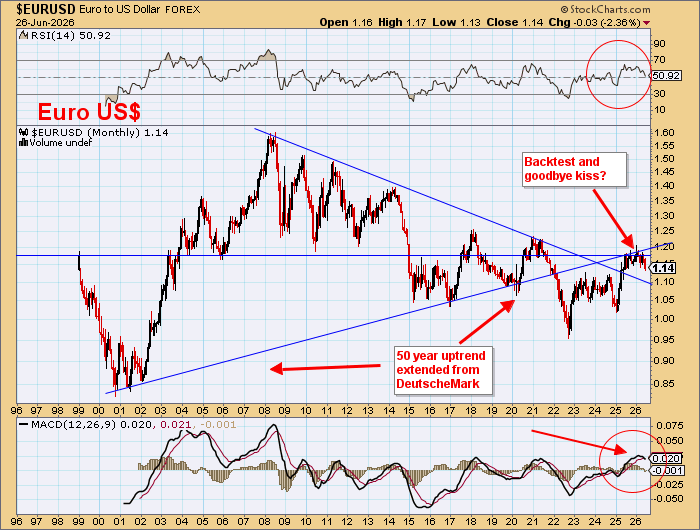
The US$ is moving higher and essentially all the major currencies have turned down to resume long term bear markets and had finished their `rallies' of the past year or so.
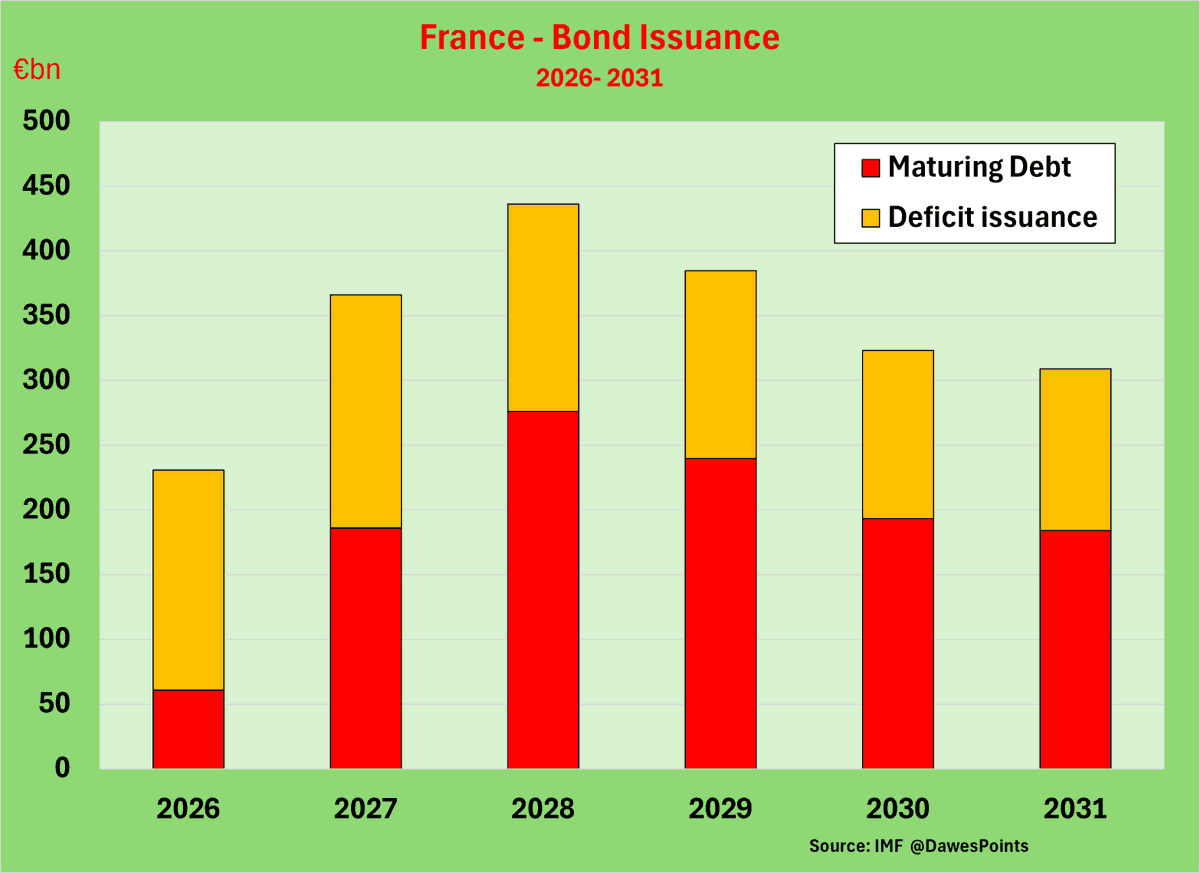
If you look at the debt and deficits of most European countries, the UK, Canada and Australia you see mostly socialist countries (+Japan) with a Wall of low coupon 2020 COVID Debt that only now is requiring refinancing at MUCH higher rates.
At the same time they are running 3-5% GDP Deficits and making no attempt to reduce them so the funding requirements are going to be huge.
Their bond markets are weakening and their currencies will follow them down.
A sovereign bond is currency with a coupon.
You don't hear much about these others because often the data isn't available in English.
Where will they get the funds from to buy these junk bonds and at what bond yield?
And all at the same time?
Also strangely, the demand for gold in these countries is miserable. Now why would that be?
The Conventional Wisdom is also that the US has the debt, the US$ is doomed and the stock market is overvalued. So gold must soar.
The conventional wisdom in markets is rarely found to be correct.
In great contrast it is ONLY the US that is making any changes.
9 consecutive months of declining YoY Outlays in the Budget while Receipts are rising at 5-6%pa.
A balanced Budget is in sight!
The US Mid Terms are now critical but the `redistricting' reversal of Blue State gerrymandering will see the Dems lose 10-15 seats and Voter ID will probably mean another 10 giving a strong GOP House and probably Senate.
DOGE's $1.5tnpa Fraud would then be an easy reduction target to reduce Outlays to that balanced Budget.
The `policy makers' at the Fed kept an inverted yield curve that ensured domestic and foreign funds flocked to T Bills and Treasury issued mostly T Bills as Treasuries matured.
~40% of Treasuries will mature by end 2027 and ~50% by end 2028.
The market is now totally underweight longer maturities because the Conventional Wisdom is that inflation will rise.
A total of ~$100bn (just ~0.3% of ALL Treasuries) are in the 10-12 year maturity. NO ONE owns them!
So the same hucksters and charlatans who told you gold was heading to the Moon were telling you a month ago that the 10 Yr yield would soar!
If no one owned them, who was going to sell their bonds?
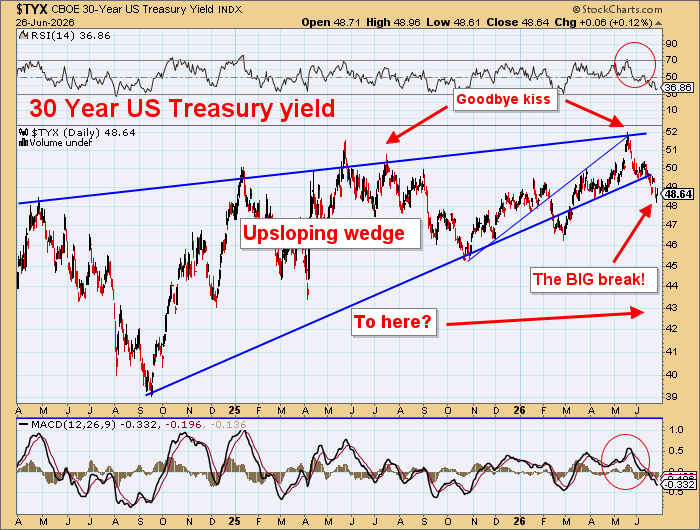
And what has just happened (most clearly) in the 30 year bond yield?
Broke down from an upsloping wedge giving good downside targets!
Heresy!
Balanced Budget, falling bond yields and US$ higher!
Right from of your lying eyes!
So coming back to gold.
5000t supply from mines and scrap needs to be bought each year.
However traditional demand has fallen substantially.
At today's $130m/t it is too expensive for those traditional jewellery and Western investment markets.
WGC data shows CBs bought about 300t in 2025 with big purchases by Poland (only ~100 t more to buy), Uzbekistan and Kazakhstan and then just rats and mice of 1-2 tonnes. China buys a few tonnes per month.
Will there be another Poland in 2027?
WGC data says only a net few tonnes bought to end April 26 after big sales by Turkey and Russia.
Which CBs bought the other ~580t no one seems to quite know!
China and India showed the collapse in jewellery and rise in investment demand in 2025 but each was net ~100t lower.
The net numbers in 2026 aren't too flash so far even though investment demand is supposed to be strong so lets wait and see.
The big growth in 2025 was ETFs but they NEED to do better in 2026 at >1,000t to absorb supply but the last WGC data said only 92t net Ytd by mid June.
Asian ETFs were big buyers in late 2025 and Jan 2026 but have been net sellers ever since.
What if ETFs turn sellers in 2026?
Who will be buying their 1000t?
The current discussion over NATO is showing the socialists in the EU are unreliable and the dopey UN and the partisan IMF aren't really the partners the US would want to talk about regarding a new Bretton Woods style Gold Standard!
So it means it will probably go it alone with a gold backed ~1% long T Bond.
Won't need to be much more than ~$200bn and it would be the standard for ALL sovereign bonds around the world would need to follow.
Gold revalued to just US$2500 would fine by me.
Can you imagine the uprisings already now underway in the highly taxed socialist states of Europe, Canada and Australia when they see no US Federal income tax up to $150k (9 States have no income tax) and corporate tax of 21% (and 15%) and no VAT/GST!
The `markets' will have to be reflecting all the above and the `policy makers' in so many countries (mostly unelected bureaucrats!) will have to REACT (not lead) and probably be run over.
We just need to look at the facts, think clearly, keep learning, protect ourselves and try to make money.
Heed the markets.
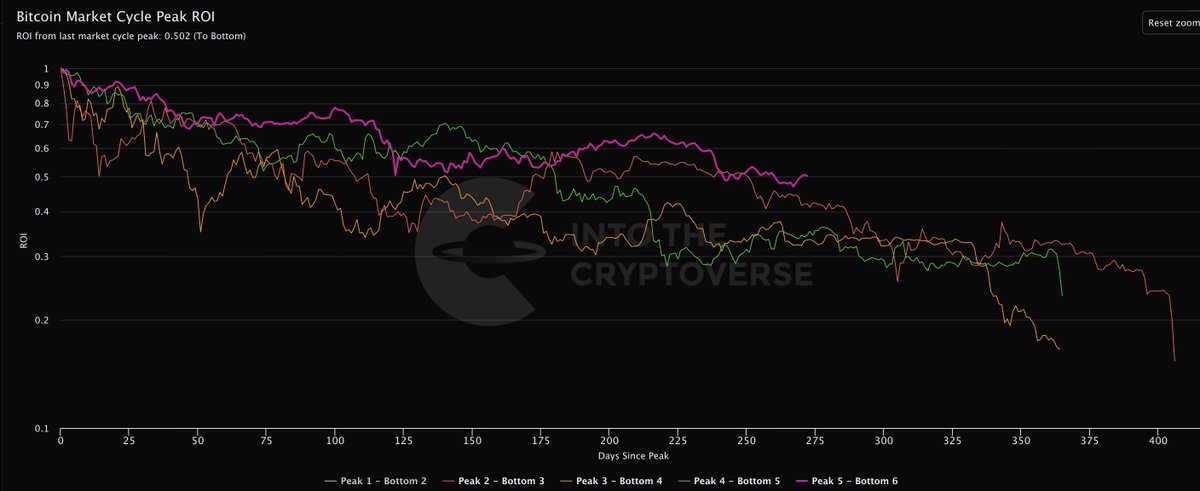
Bitcoin's 2026 bear market performance is now closest to the first bear market in 2014.
The unification zone (where all bear markets have lined up) starts in just 10 days, which means Bitcoin would need to be at least 50k by June 18th.
Everything's right on track.
$BTC's CVDD/Price Ratio is at 0.73 and climbing.
At prior cycle lows it peaked near 1 (0.90/0.91/0.95 in 2015/18/22) as price meets the CVDD floor.
With the current floor ~$46K, a repeat would point to a bottom near $52–59K, ~12–13 months past the Oct 2025 ATH → Q4 2026.
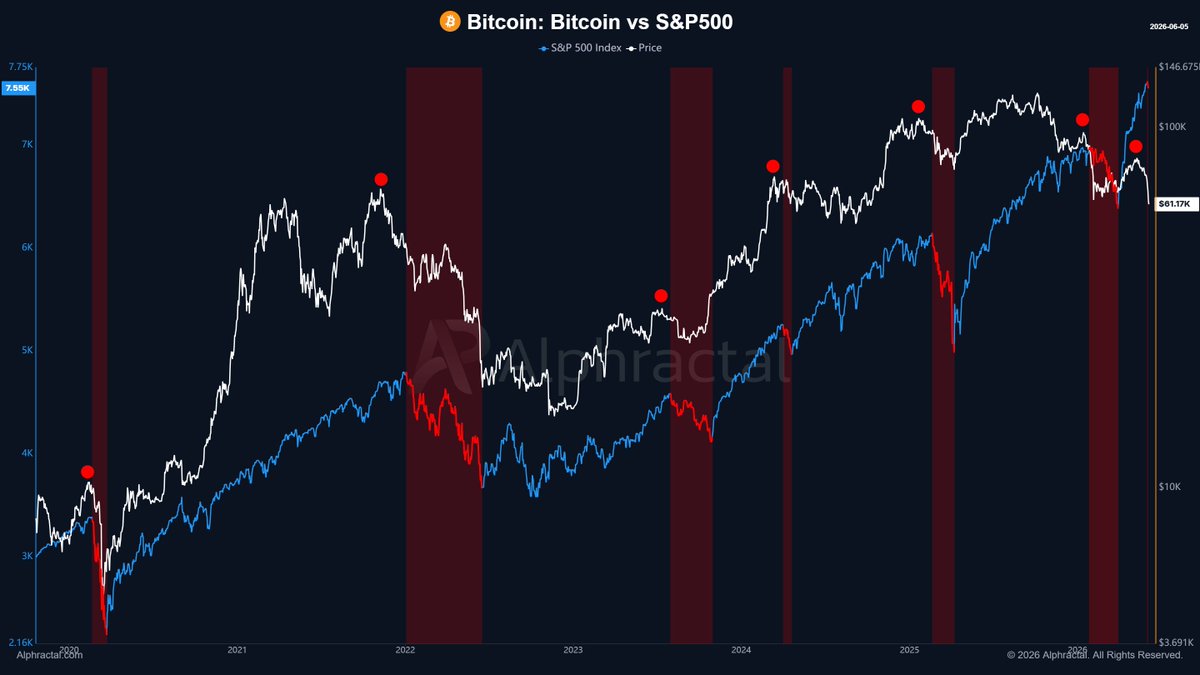
Several times in recent history, Bitcoin started falling before the S&P 500.
In many moments, BTC acted as an early warning signal for selling pressure in traditional markets.
This became even more evident after the Corona Dump in 2020, when the correlation between crypto, global liquidity, and risk assets became much more sensitive.
Bitcoin trades 24/7.
The S&P 500 does not.
That is why, when liquidity starts drying up, BTC often feels it first.
Maybe crypto is not just “more volatile.”
Maybe it is the first market to scream when risk starts leaving the table.
@Alphractal
This bull market started slowly in terms of earnings, but boy have they caught up. Based on current estimates, earnings will likely continue to play a large role in shaping this cycle.
And those earnings are supported by margin expansion, which are a powerful driver for valuation. While the S&P 500 index is in the upper reaches of its valuation band, the 22x forward P/E ratio is supported by both margins and credit spreads.
The four year cycle for Bitcoin is not dead.
Bitcoin topped when it always topped (to within 1 week when measure from low-to-high), so why can't it bottom near the end of the midterm year, just as it generally has? (1/x)
🇮🇹 Italy population, by year:
1950: 46M
1980: 56M
2014: 60.7M (peak)
2024: 59.3M
2050: 51.9M
2100: 35.4M
A 25M decline from peak. The first major Western country has already passed the turning point of permanent decline.
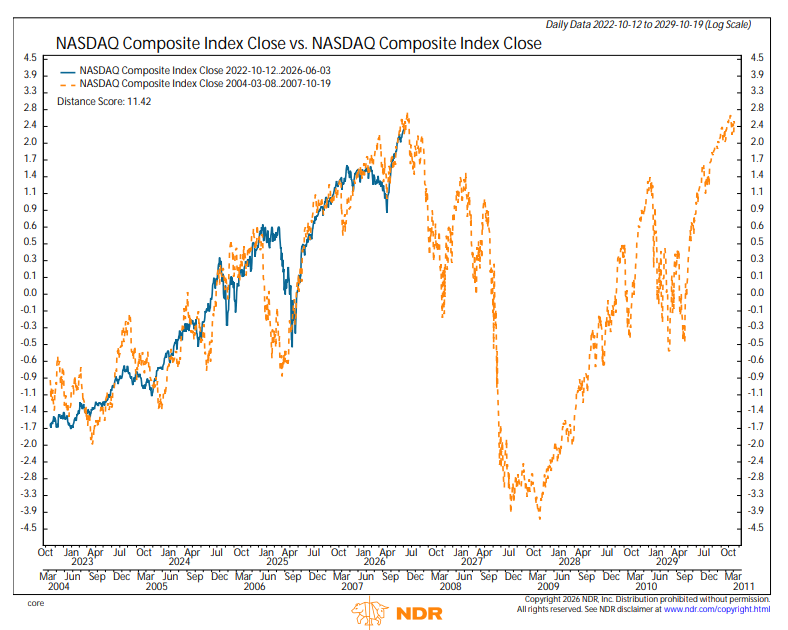
With the AI theme continuing to accelerate higher, should we be back on bubble watch, as we were last October when things started to get frothy? I haven’t shown my bubble analog in a while, so we are due for an update. Below is the comparison between the internet boom-turned-bubble 27 years ago and the AI boom that started in 2023. The GS data centers basket is following a similar track to the IIX internet index back in 1999. Note that the two indices are on the same log scale (indexed to the Netscape IPO in 1996 and the ChatGPT launch in 2022), making for an apples-to-apples comparison.
For the S&P 500 index, the analog continues to track almost perfectly. Here I have indexed the post-tariff tantrum rally since April 2025 to the post-LTCM rally from late 1998 to 2000. We will see how it all turns out, as analogs work great until they don’t. But with the capex boom now leading to a late-stage earnings boom, the narrative is definitely there for a blow-off rally.