Please allow me to translate the profound message Linda is conveying. She is noting that the intraday price uptrend on Monday is very linear, such that even a very tight stop is not getting hit. Signal processing engineers would say that there is a high "signal to noise" ratio.
Smooth intraday trends typically happen when there is a large amount of money that needs to get put to work, but the big firms don't want to dump a large order into the market all at once and move prices. So their trading desks use algorithms to chop up the large slug of money into smaller pieces, doling orders out more slowly. This results in that linear form of the intraday chart plot.
The key takeaway, therefore, is that there must be a large amount of money deciding to move now, based on seeing footprints in the intraday plot which match the behavior of prices when that condition is in effect.
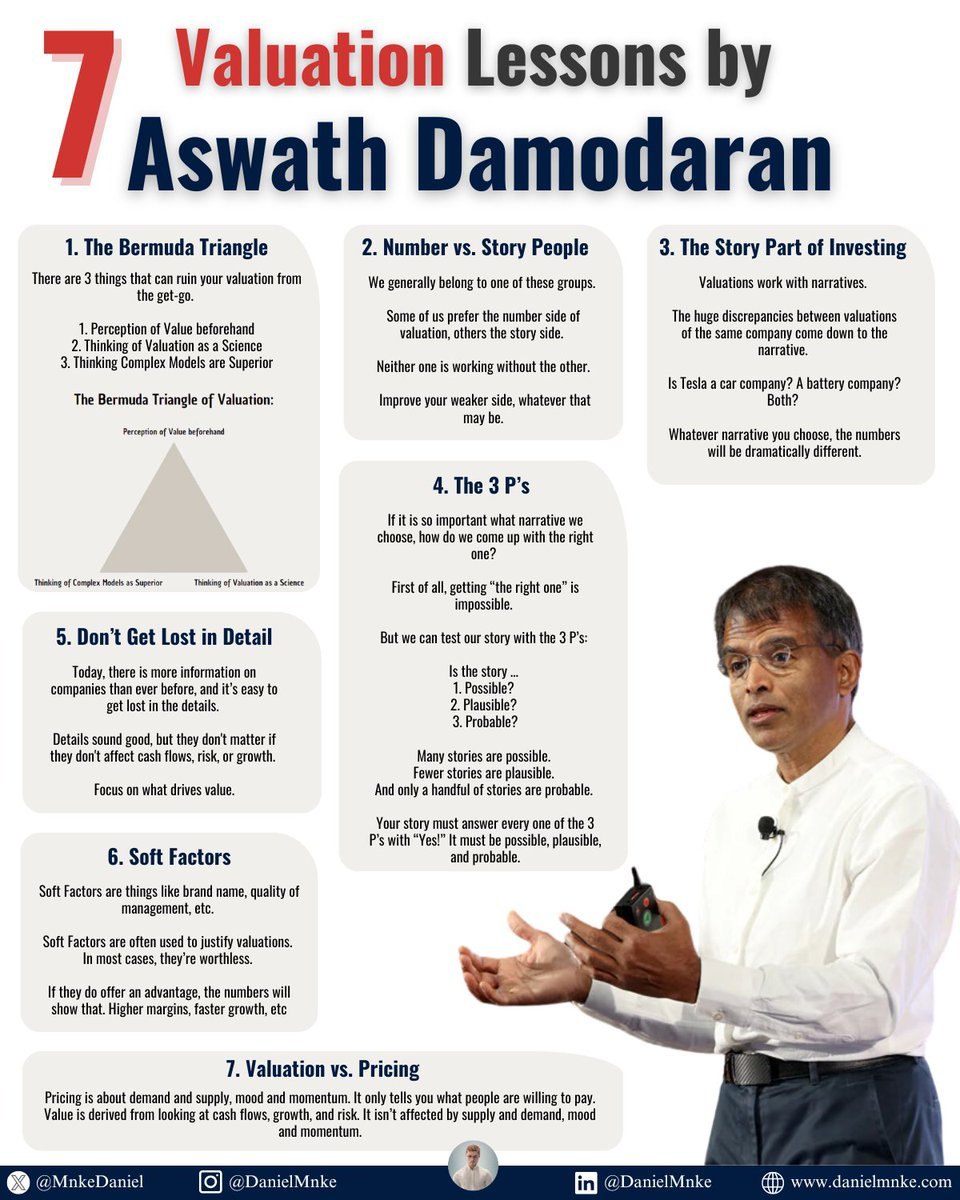
Aswath Damodaran currently has one of the largest cash holdings he's had in a long time.
He's highly skeptical of today's markets.
Here are some of my favorite lessons from hours of interviews, his books, and an investing course:
In 2021, Stanley Druckenmiller explained how he compounded at 30% for 30 years straight.
He broke down why:
- Winning isn’t about being right
- Markets reward puzzle-solvers
- Entitlements threaten youth
12 lessons from Druckenmiller on markets, risk and the future of America:
Market Wizard Linda Reschke's 12 Technical Trading Rules: @SJosephBurns
1. Buy the first pullback after a new high. Sell the first rally after a new low.
2. Afternoon strength or weakness should have follow through the next day.
3. The best trading reversals occur in the morning, not the afternoon.
4. The larger the market gaps, the greater the odds of continuation and a trend.
5. The way the market trades around the previous day’s high or low is a good indicator of the market’s technical strength or weakness.
6. The previous day’s high and low are two very important “pivot” points, for this was the definitive point where buyers or sellers came in the day before. Look for the market to either test and reverse off these points, or push through and show signs of continuation.
7. The last hour often tells the truth about how strong a trend truly is. “Smart” money shows their hand in the last hour, continuing to mark positions in their favor. As long as a market is having consecutive strong closes, look for up-trend to continue. The up trend is most likely to end when there is a morning rally first, followed by a weak close.
8. High volume on the close implies continuity the next morning in the direction of the last half-hour. In a strongly trending market, look for resumption of the trend in the last hour.
9. The first hour’s range establishes the framework for the rest of the trading day.
10. A greater percentage of the day’s range occurs in the first hour then was the case in the past, and thus it has become increasingly important to trade aggressively if there are early signs of a strong trend for the day.
11. There are four basic principles of price behavior which have held up over time. Confidence that a type of price action is a true principle is what allows a trader to develop a systematic approach.
The following four principles can be modeled and quantified and hold true for all time frames, all markets. The majority of patterns or systems that have a demonstrable edge are based on one of these four enduring principles of price behavior.
Charles Dow was one of the first to touch on them in his writings. Principle One:
A Trend Has a Higher Probability of Continuation than Reversal Principle Two:
Momentum Precedes Price Principle Three:
Trends End in a Climax Principle Four:
The Market Alternates between Range Expansion and Range Contraction!
12. In the world of money, which is a world shaped by human behavior, nobody has the foggiest notion of what will happen in the future. Mark that word –
Nobody! Thus the successful trader does not base moves on what supposedly will happen but reacts instead to what does happen.
I spend basically my entire life on X ... this platform is the best free tool out there for the stock market
If you're following the right people
Here are a bunch of my favorite accounts you should check out 👀
“AI is a bubble”? No. AI is the beginning of a new cycle.
Yes, some tickers are pure fantasy — no revenue, no profits, yet massive valuations. We’ve seen that story before.
The strategy is simple: buy quality. Own companies with real products, real revenue, and real cash flow.
And don’t forget: this wave will create new giants and bury the ones that refuse to change.
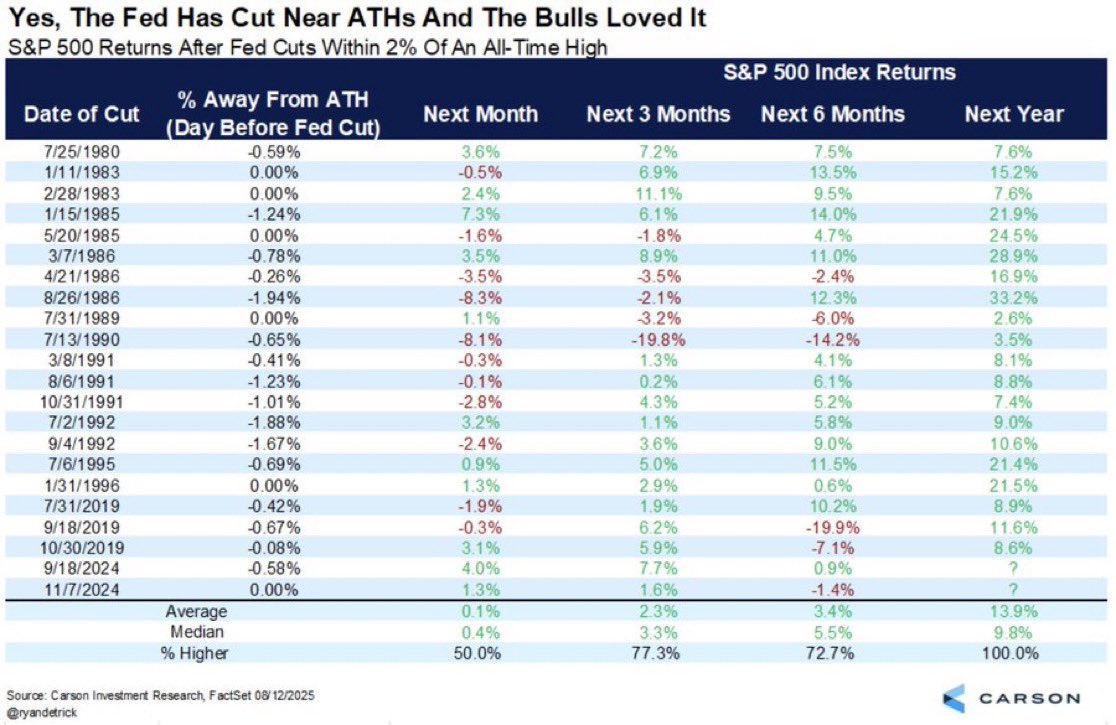
When the Fed cuts interest rates within 2% of stock market all-time highs, the S&P 500 has gone on to finish higher over the next 12 months 20 out of 20 times (100% hit rate) 🚨🚨🚨
The ENTIRE AI Value Chain - & the Stocks Powering It
From chips to apps, here’s who wins in AI:
- Semis: $TSMC, $AMD, $INTC, $NVDA, $MRVL, $AVGO, $SKHynix, $SSNLF
- Data Centers: $DELL, $CSCO, $SMCI, $ANET, $PSTG
- Infra: $DUK, $NEE, $EQIX, $ABB, $VRT, $SchnE
- Cloud: $MSFT (Azure), $GOOGL (GCP), $AMZN (AWS), $ORCL
- Data: $SNOW, $MDB, $PLTR, Databricks, Scale AI
- Models: OpenAI, $META, Anthropic, Mistral
- Apps: $MSFT Copilot, Perplexity, Midjourney
The real money may be in the picks & shovels - not just the flashy apps.
Which AI stock are you betting on? 👇
The 101 on $GOOG risk:
Search is shifting away from the traditional blue-link results page that we've loved for the past 25 years, to a simplified AI-powered result.
That reality is negative for Google on two fronts:
First, the monetization model of sponsored ads needs to be overhauled.
Second, Google Search has new competitors, including OpenAI, Grok, Perplexity, etc.
Did you know there’s a way to predict the S&P 500 with an ~85% correlation?
Sounds insane, but it’s true.
Here’s the surprising logic behind my claim: