Data visualization is not merely about creating pretty charts and graphs; it’s about distilling complex information into clear, concise visuals that facilitate understanding and decision-making. https://t.co/JmnxDMZIew
#DataScience#rstats#dataviz#dataScientists#dataAnalysts
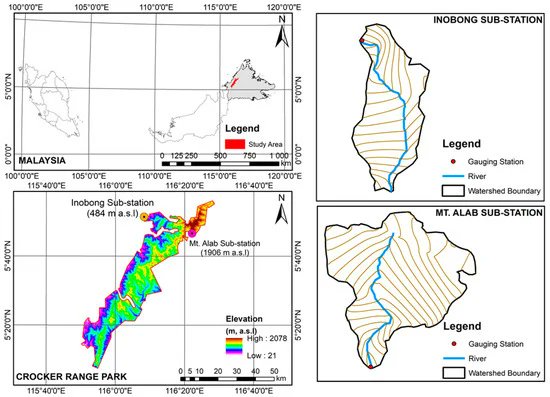
Higher Water Yield but No Evidence of Higher Flashiness in #Tropical#Montane Cloud #Forest (TMCF) Headwater #Streams
Full access: https://t.co/nWrOfAkDjv
by Anand Nainar, Anand Nainar et al
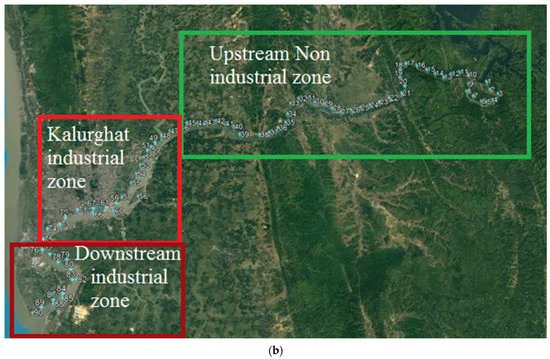
Suitability Assessment of #Fish_Habitat in a Data-Scarce #River
Full access: https://t.co/c2zPGZTsvj
by Aysha Akter, Md. Redwoan Toukir and Ahammed Dayem
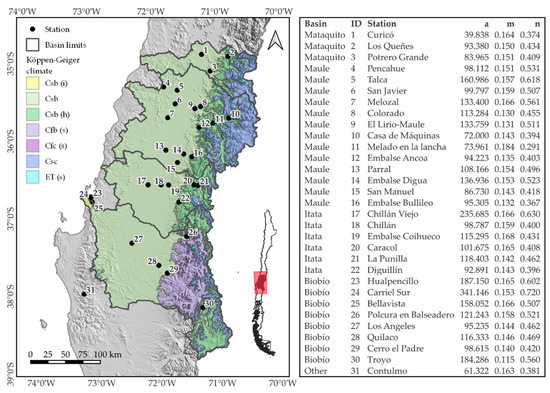
Comparing Methods for the Regionalization of Intensity−Duration−Frequency (IDF) Curve Parameters in Sparsely-Gauged and #Ungauged_Areas of Central #Chile
Full access: https://t.co/ODpNSYrqRG
by Claudia Sangüesa, Roberto Pizarro et al
In questo bell'articolo di @Elisa_Buson sulla rivista Prisma (https://t.co/wjdtc6tRwf) parliamo del Gemello Digitale del Ciclo dell'Acqua sviluppato nei progetti @ESA_EO@TarolliP parla del cuneo salino nel bacino del PO
Articolo: https://t.co/PLVWjhFIAq
The #matlab code here at the source: https://t.co/XhgmSC0wAH
Implementation of a vorticity-streamfunction method with a pseudo-spectral discretization + third-order Runge-Kutta for time integration.
I am grateful to ASCE Environmental Water Resources Institute and ASCE Journal of Hydrologic Engineering for recognizing our work with the Best Technical Paper award! Congratulations to Tao Huang for his contribution!
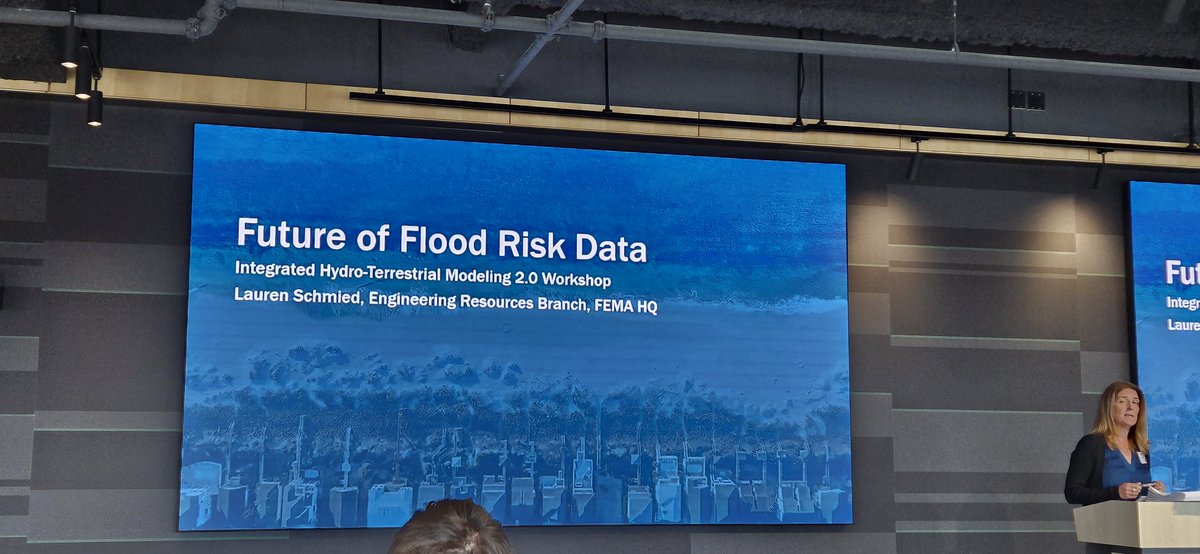
Very informative and busy Day 1 at @usgcrp Integrated Hydro-Terrestial Modeling: IHTM 2.0 workshop. So many models from so many agencies! How can we integrate them to solve water related problems?
2023 is shaping up to be hottest year on record, after extraordinary temperatures since June (and ahead of peak of warming El Niño).
🔗Updated WMO news article with figures from @CopernicusECMWF, @NASAClimate, @NOAA
https://t.co/HAGKhHiRjT
#StateofClimate
📷NASA/Peter Jacobs