Building geospatial AI at SPARC Global. Ex-founder (DYNE, exited). Published AI researcher | Expert AI voice on Minnect | Turing Frontier Fellow. Skier and Polo
Rolled out of bed looking like this and built the whole thing on my phone with AI agents. NASA Space Apps Toronto 2026: Winner, Local Impact; 1st Runner-Up, Global Connection; 2nd Runner-Up, Best Use of Data. @NASA@SpaceApps@SpaceAppsTO
30-second demo: https://t.co/LRbviELHqc
Atlas blocked its own automatic guess. The fit it kept has a trusted error of 6.15 m.
Atlas lines up scanned land-record maps with satellite imagery. Every starting guess is tested on a point it never used, and the 25 m accuracy gate does not move. In the reference run, the automatic guess failed it. Road matching points did the work instead, for that trusted error of 6.15 m. The first image shows the blocked guess and the final fit.
The other fit I distrust is one that matches every point exactly. I read that as a warning. Real map alignments have error, and the reference run's is 6.15 m. So when a map-bending fit looks too perfect, Atlas drops to a simpler one. The second image is the scan-to-satellite view.
Would you trust a map fit with zero error?
Rain and radar make a town-by-town water map and drafted alert.
Risky fire seasons from a 2003-2025 record.
Next season's crop map, pre-planting.
Orbit to Ground, my NASA Space Apps Toronto 2026 project: NASA satellite data into a local next move.
Try it: https://t.co/3KSapaeOuW
Copernicus data show severe and extreme low river flows across Central America, the Amazon and parts of South America, driven by rainfall deficits, high temperatures and El Niño.
If your work runs on a river, read that as an operations signal: shipping on the Amazon, hydropower, irrigation, mine water supply.
A river flow map tells you where to look first. Local gauges and checks on the ground tell you what it means for a specific site.
Which river-dependent operation would you watch first?
The USGS Burn Severity Portal got a major update: 315 newly mapped fires for MTBS, 25 added through BAER, 67 new RAVG datasets, and wider Direct Download access. MTBS is an archive of nearly 31,000 large US fires going back to 1984.
The line I'd act on is the reissue. Hundreds of products that were pulled for reprocessing are back. If your project uses burn severity layers you downloaded before that, your copy may not match what the portal serves now. Re-pull and note the release date in your project.
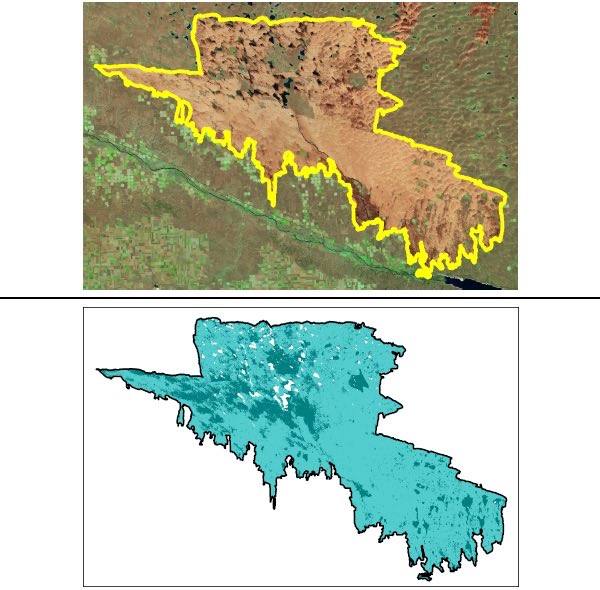
Also look at the Morrill Fire example from Nebraska (645,000+ acres). The white patches on the severity map are areas that were obscured or couldn't be classified. Read them as missing data. They don't tell you the ground was unburned.
How do you keep track of which version of a public dataset your analysis used?