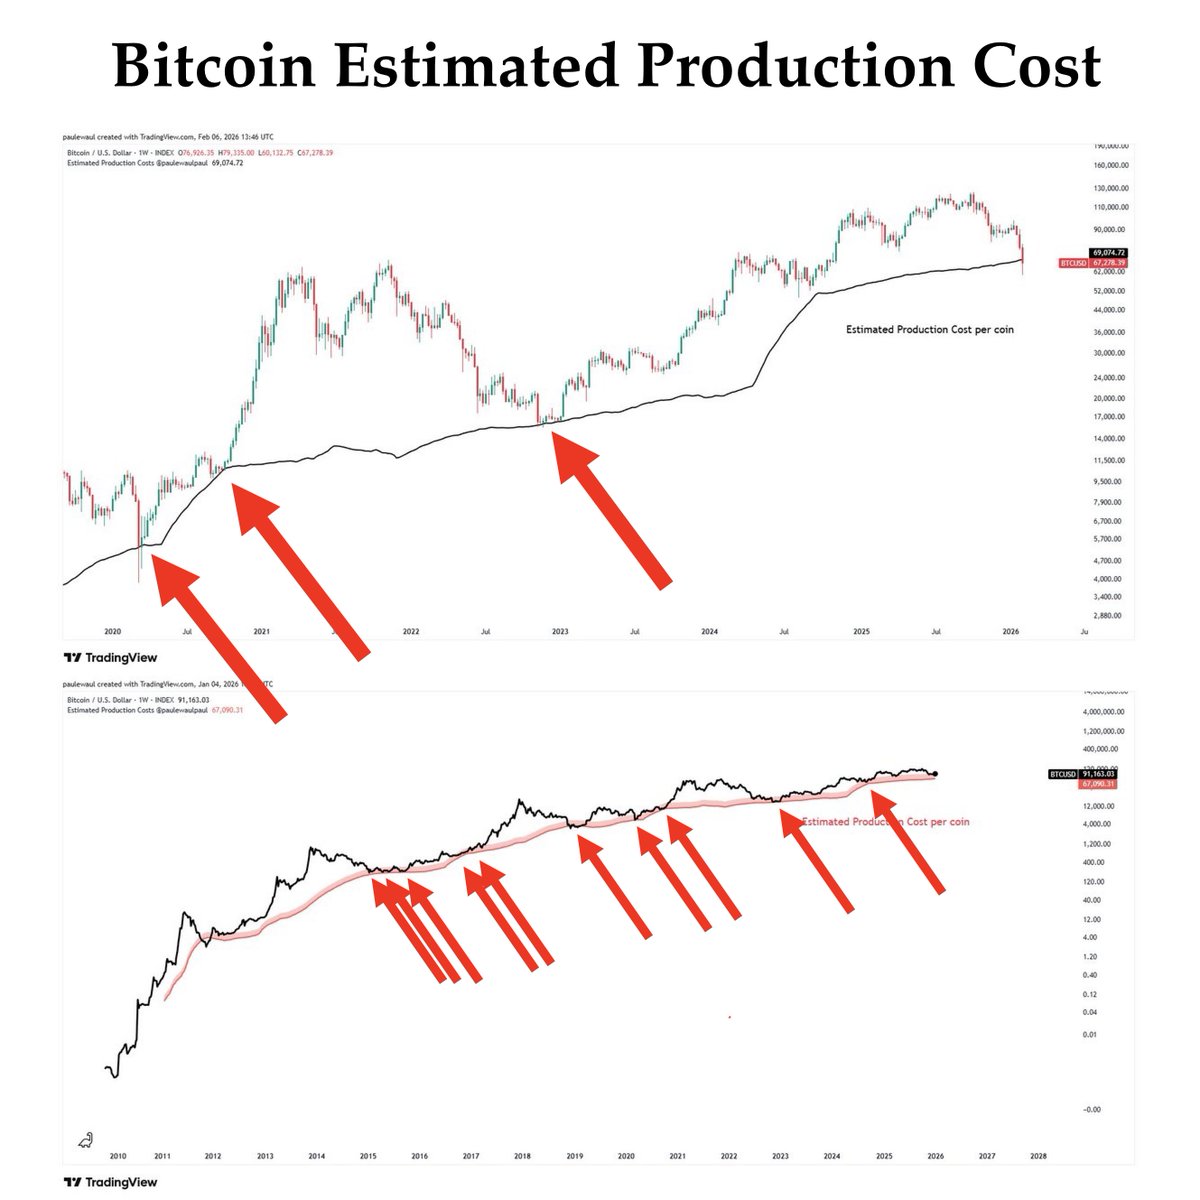
Important: One of the most significant Bitcoin charts you have most likely never seen!
Notice how many times Bitcoin has found support at this estimated cost of production red line.
The line currently sits at $67,000.
This is not just on-chain data—this is a cost of production model for Bitcoin, which is a commodity, and commodities almost never trade below their cost of production.
Shout out to (@)paulewaulpaul for creating this chart.
Make sure you give him a follow; he does unique and great work.
ALERT: Is a Circuit Break about to be triggered by the COMEX, due to Silver RAGING PAST $85 this morning? Up nearly 7%!!!
From the COMEX: "Daytime trading employs market-wide circuit breakers, a kind of price limit that halts trading for a period of time to help the market reset. CME Group U.S. Equity futures markets are coordinated with stock circuit breakers at market 7%, 13%, and 20%. The 7% and 13% circuit breakers are each followed by 10-minute trading halts; if the 20% level is reached, the market closes for the trading day."
Check out my #BTCUSD/IXIC analysis on @TradingView: https://t.co/7W0BP62VD2 Bitcoin against the Nasdaq: hanging diamond on the weekly. Be carefull, diamonds are sharp!
Check out my #BTCUSD analysis on @TradingView: https://t.co/52E8EvH2xY #bitcoin Upper two lines are 4.236 extensions on weekly (black) and daily (red). Let's see if it comes there.