BREAKING: China bought +10 tonnes of gold in May, the largest monthly addition since January 2025.
This follows +8 tonnes acquired in April, marking their 3rd consecutive monthly net purchase.
China has now bought gold for 19 consecutive months, the longest streak since at least 2015, when its central bank began publishing more regular data on its gold reserves.
This brings China's official gold reserves to a record 2,331 tonnes, worth over 9% of their total FX reserves.
The country is also the 3rd-largest central bank buyer year-to-date, after Poland and Uzbekistan, with a total of +27 tonnes added.
China’s demand for gold is accelerating.
Institutional investors are aggressively shorting the Japanese Yen even as Japan is attempting to intervene:
Combined Yen short positions held by leveraged funds and asset managers are up to -$11 billion, the highest since July 2024.
We have now seen 3 consecutive weekly increases in short exposure, totaling -$5 billion.
This comes despite Japan’s Ministry of Finance spending a record ~$74 billion over the past month to defend the currency from weakening.
However, the Yen has weakened to ~160 per US Dollar from ~155 in early May and is approaching the critical 160 threshold again.
This reflects the wide interest rate gap between Japan and the US, which remains the primary structural pressure on the currency.
Institutional positioning continues to signal further Yen weakness.
Let me tanslate sell-side investment banking-speak for those of you unfamiliar with the lingo:
"10x oversubscribed" = 2x the offering size
"5x oversubscribed" = exactly the offering size
"2x oversubscribed" (as claimed below) = 50% of the offering size
$SPCX
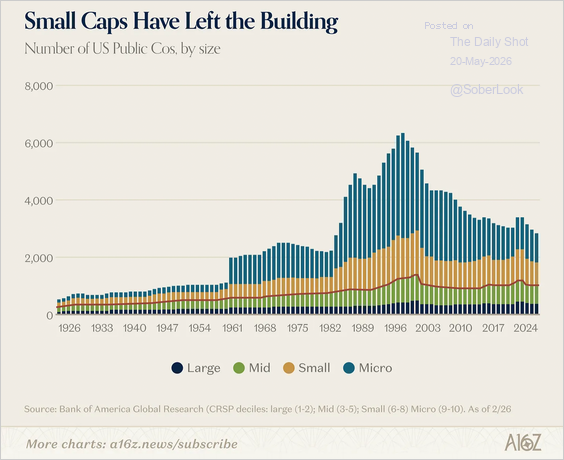
The structure of the market is experiencing a historic shift:
The number of US-listed ETFs is up to ~4,900, an all-time high, up +95% since 2020.
Over the same period, the number of US publicly listed companies has declined -1,000, or -20%, to ~3,900, the lowest this century.
As a result, there are now ~1,000 more ETFs than stocks to trade in the US market, the widest gap in history.
Meanwhile, US ETF assets under management (AUM) jumped +10% in April, to a record $14.9 trillion.
Over the last 4 years, US ETF AUM has surged +140% and now accounts for ~69% of the global ETF market.
ETFs are reshaping the foundation of financial markets.
THE FED IS ABOUT TO CUT WHILE THE ECONOMY BOOMS.
🇺🇸 New Fed Chair Kevin Warsh: AI is "structurally disinflationary." Per his WSJ op-ed.
Same pattern. Different decade.
1995: Greenspan saw the productivity boom. Let the economy run hot. Cut rates anyway.
Result: 7 years of risk-on. Nasdaq up 1,132%.
Musk, Altman, Bezos, Druckenmiller all agree: AI is deflationary.
Warsh just took the chair. June 16: his first FOMC.
The next few years are going to be insane.
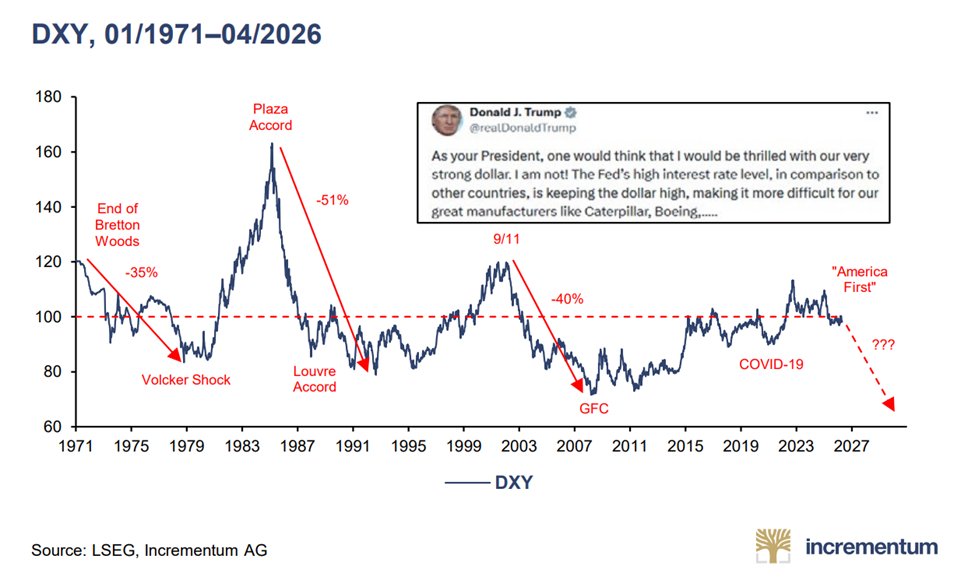
This remains one of the most important charts of the next few years ahead.
Do not underestimate the power of long-term decline in the dollar.
Ignore the near term moves in the counter direction, in the big picture the US dollar is at a critical juncture and US policymakers have no option but to devalue the currency.
The implications out of this move will be profound.
https://t.co/XiogYIdEzM
Good Morning from Germany, where the road to socialism is paved with ever-rising govt consumption. Since 1999, state consumption is up 63%, while GDP has risen only 31% and capital investment a meagre 16%. The public sector keeps expanding, but the investment base is stagnating. Germany is becoming less of a market economy and more of a state-led redistribution machine.
Thoughts from Michael Hartnett, BofA | Door To Doom Has Opened
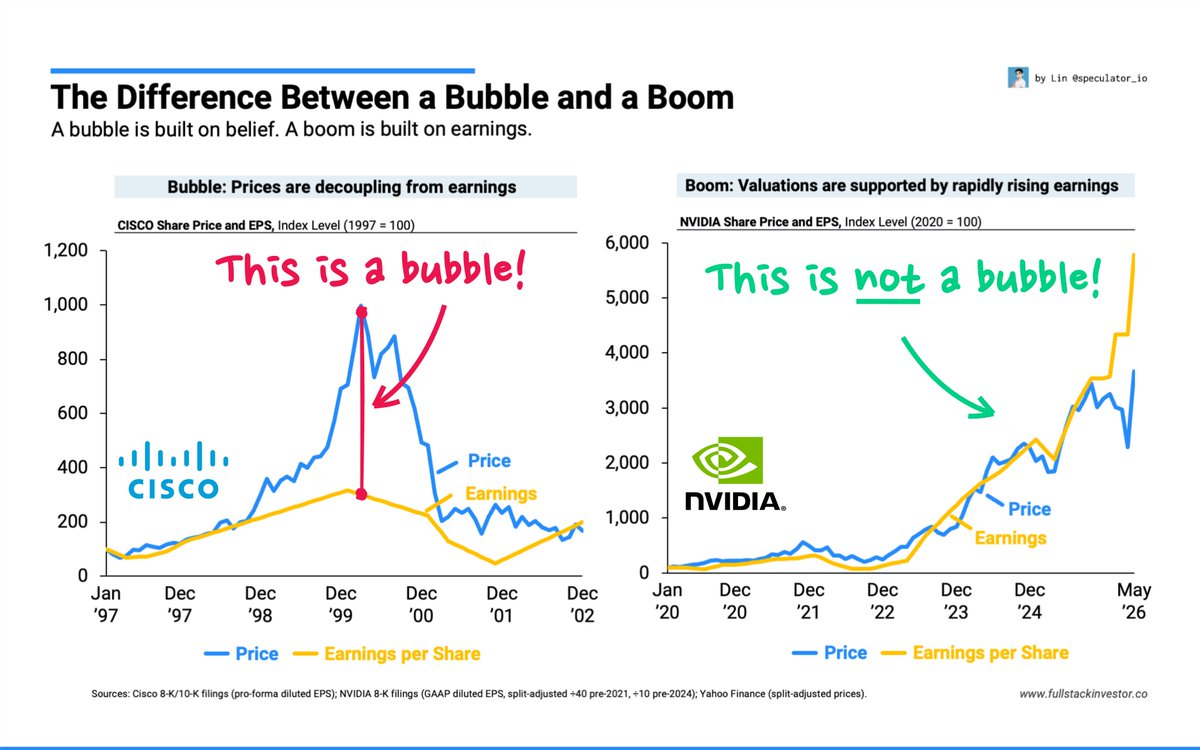
Markets are entering a dangerous late-cycle “melt-up” phase similar to 1999 (dot-com bubble) and 2009, driven by a combination of:
•rapidly rising US Treasury yields (10Y and 30Y above key resistance levels)
•persistent inflation risk (US CPI potentially moving back above 5%)
•extreme concentration and valuation in AI/semiconductor stocks
•a widening disconnect between stocks and bond markets.
•Once long-term yields break higher decisively, a bond market shock could trigger a sharp correction in equities.
•Semiconductor stocks are behaving similarly to historical bubbles, with the SOX index trading far above long-term averages.
•Current market behavior resembles prior speculative peaks where both stocks and yields surged together before instability followed.
•US household wealth has been massively inflated by equities, reinforcing a self-sustaining “boom loop.”
•Political backlash from inflation and inequality could eventually shift capital away from AI/chips toward more consumer-focused sectors.
The market is not necessarily at immediate collapse, but the combination of high yields, sticky inflation, AI euphoria, and stretched valuations creates conditions historically associated with bubbles and elevated systemic risk.
💰$1.6 trillion
That's the combined market cap of the global mining industry.
Here's who controls it and why it matters⛏️
Every AI chip, every EV battery, every data center rack, every missile defense system runs on what these companies pull out of the ground.
This is the scoreboard of who controls that supply🌍
🇦🇺 BHP $125.5B the world's largest miner, by distance
🇨🇳 China Shenhua Energy Co., Ltd. $102.8B state-owned, coal and energy dominant
🇦🇺 Rio Tinto $97.4B iron ore, copper, lithium
🇲🇽 SOUTHERN PERU COPPER CORPORATION $76.9B Americas copper king
🇺🇸 Freeport-McMoRan $57.5B largest publicly traded copper producer
🇨🇳 Zijin Mining Group $56.8B fastest-growing Chinese miner globally
🇨🇭 Glencore $54.7B commodities trading + mining combined
🇸🇦 Maaden $48.8B Saudi Arabia's national mining champion
🇺🇸 Newmont Corporation $47.7B gold dominant
🇧🇷 Vale $37.3B nickel and iron ore
China is not just a buyer. It's a producer.
China Shenhua + ZiJin alone = ~$160B in market cap.
Both state-linked. Both expanding aggressively in Africa and Latin America.
When Washington talks about critical mineral security, this is exactly what it's talking about.
The Americas hold the copper.
Southern Copper, Freeport, GrupoMexico, Vale the Western Hemisphere controls an enormous share of global copper supply.
In a world where copper takes 18 years to bring to market and AI data centers need it in 18 months, that geography is leverage. see my latest article on it, the link is in the below comments
$1.6 trillion controls the physical inputs for the entire global technology and energy transition stack.