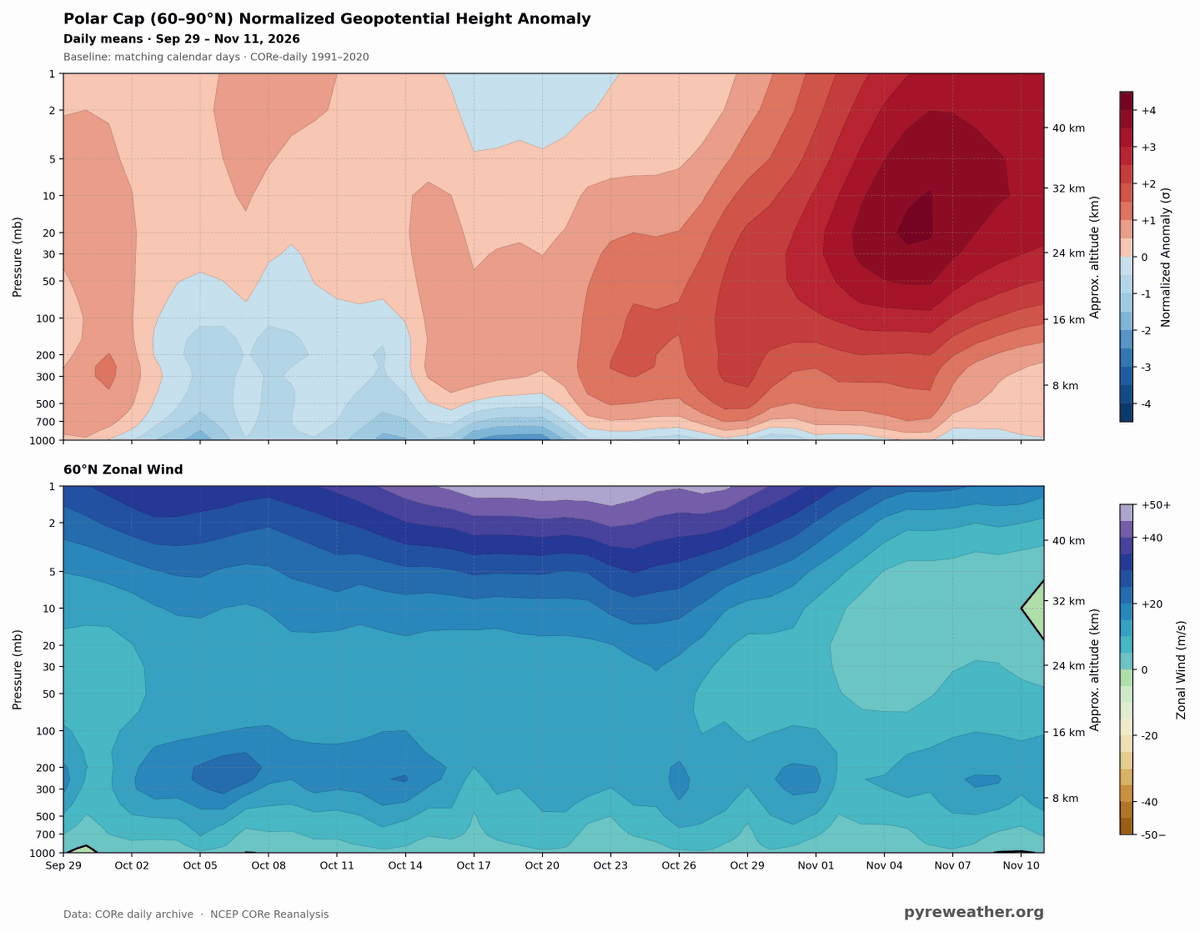
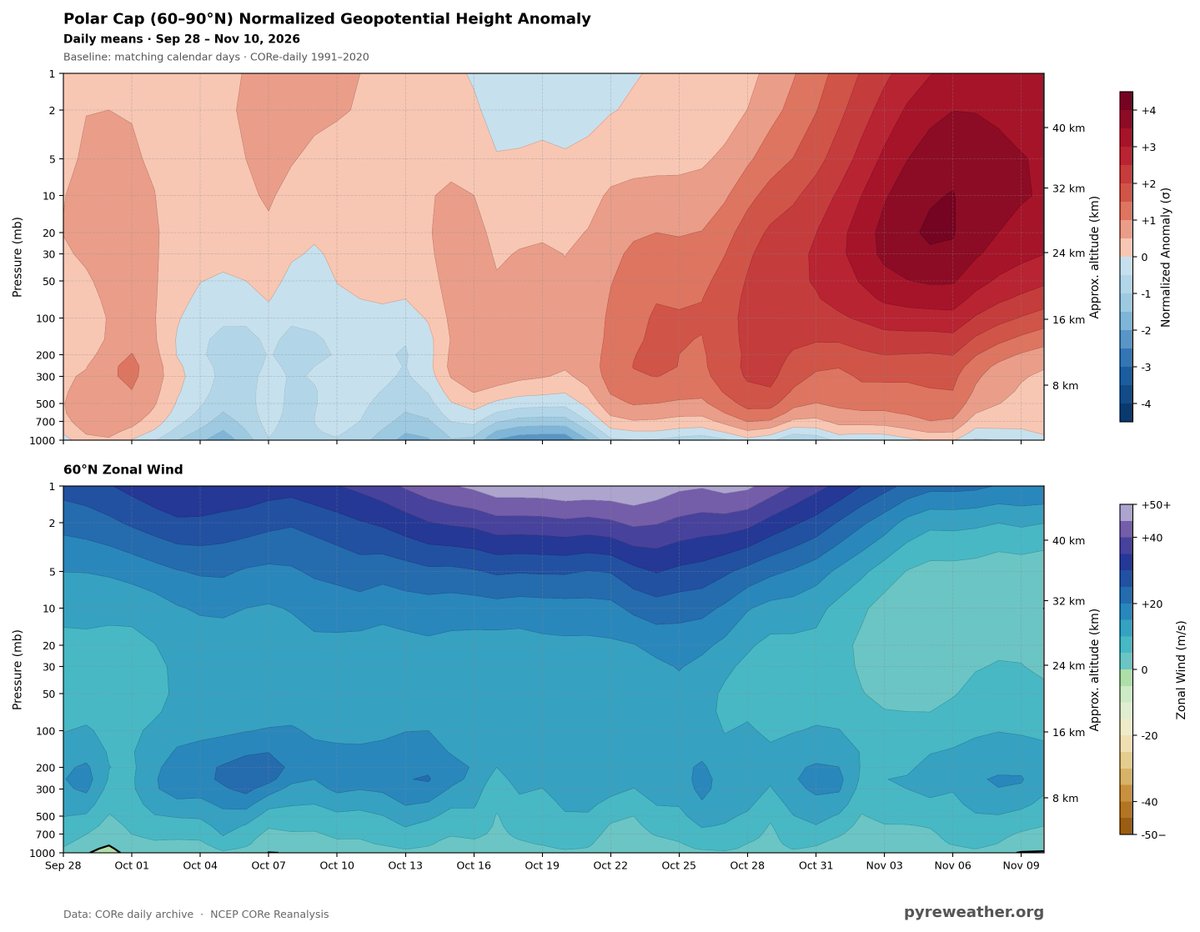
BOOM! Here it is!! That little green wedge on the right side of the lower image? that's the easterly turn of the 10mb winds at 60N Latitude.
The Sudden Stratospheric Warming event has officially arrived!!
@Statisticizer
Rapidly rising height anomalies in the stratosphere (heavy read blobs on the right) along with weakening westerlies (light blue bubble right side) foretell a sudden warming event in the stratosphere. This data lags by about 24 hours, but the reversal has already been reported.
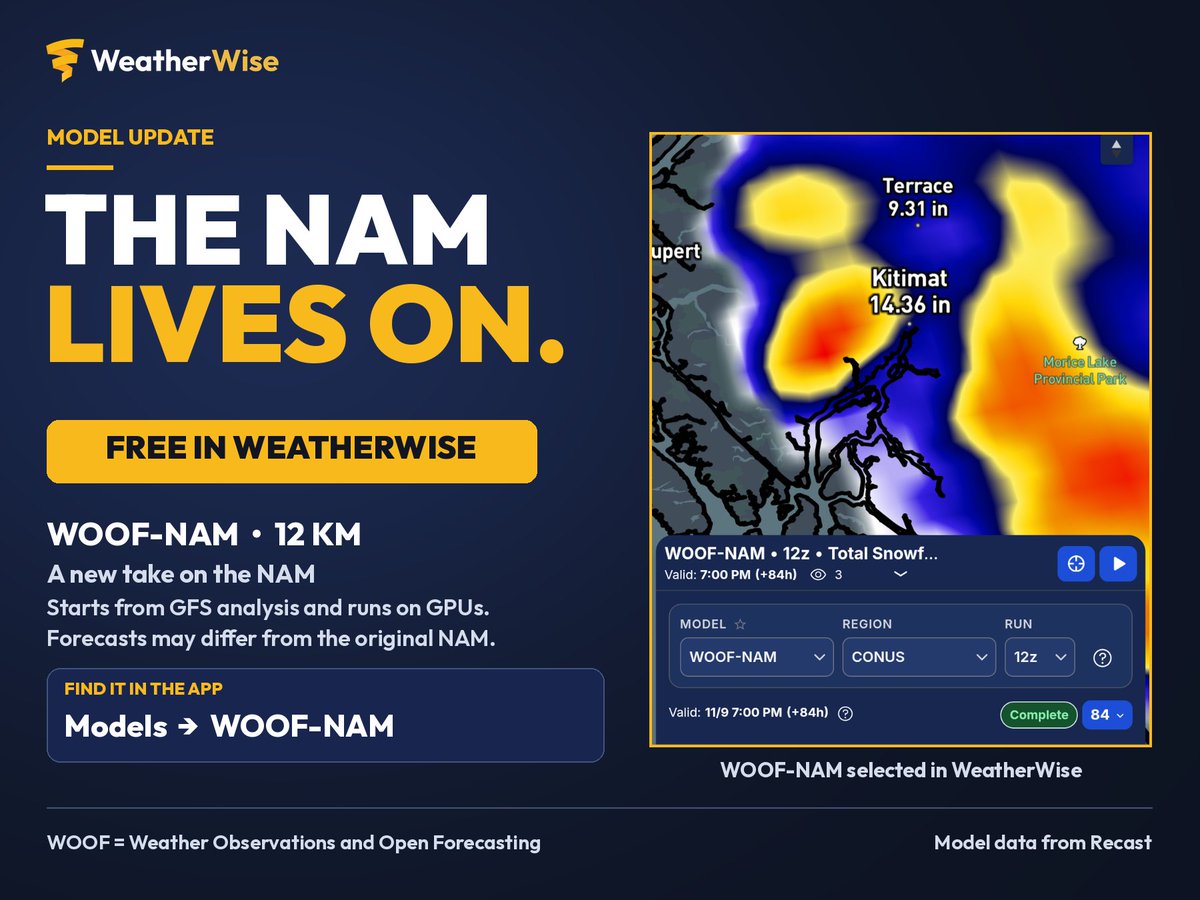
Remember that NAM memorial? About that… 📷
WOOF-NAM is now FREE in WeatherWise.
It’s a 12 km version of the NAM that starts from GFS analysis and runs on GPUs, so its forecasts can differ from the original NAM.
Open WeatherWise → Models → WOOF-NAM to check it out. No Pro subscription needed.
Huge thanks to @recast for making the model data available!
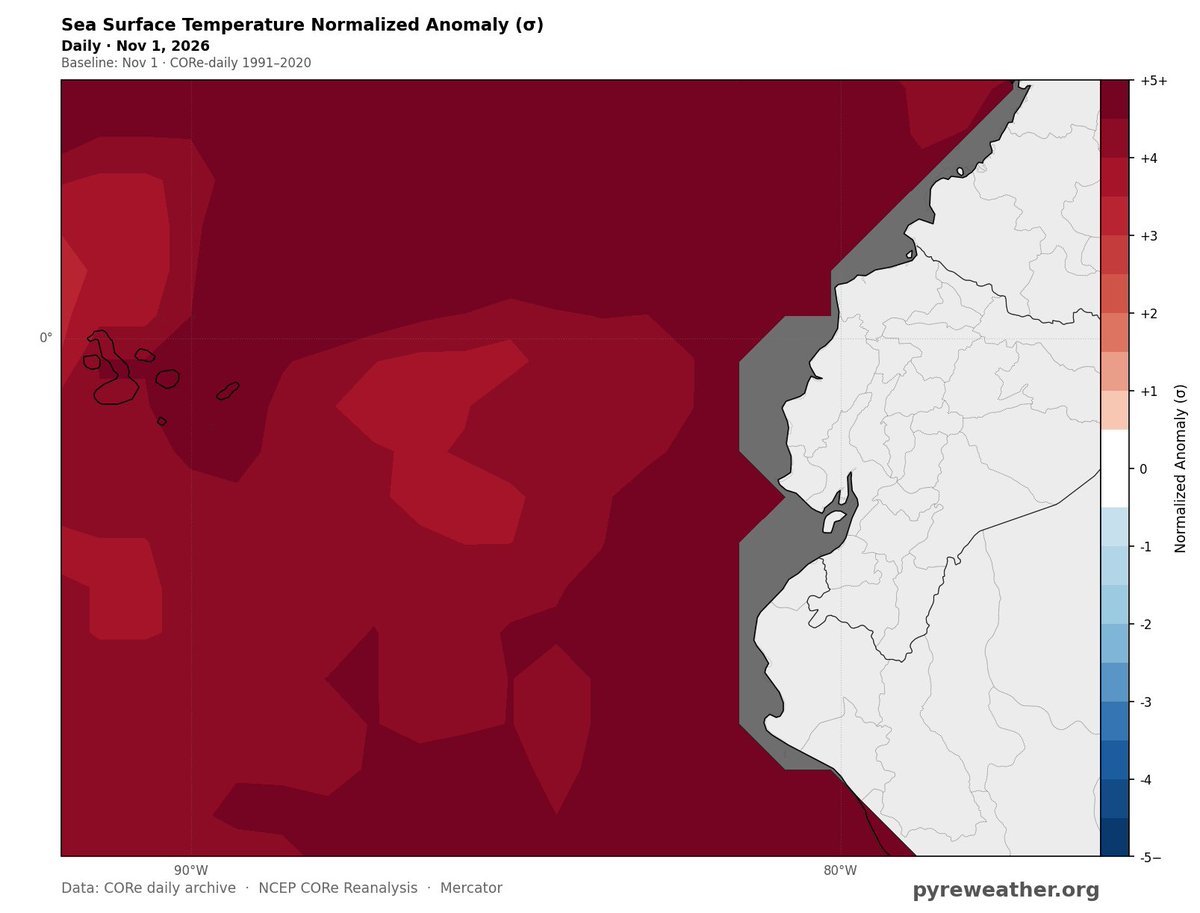
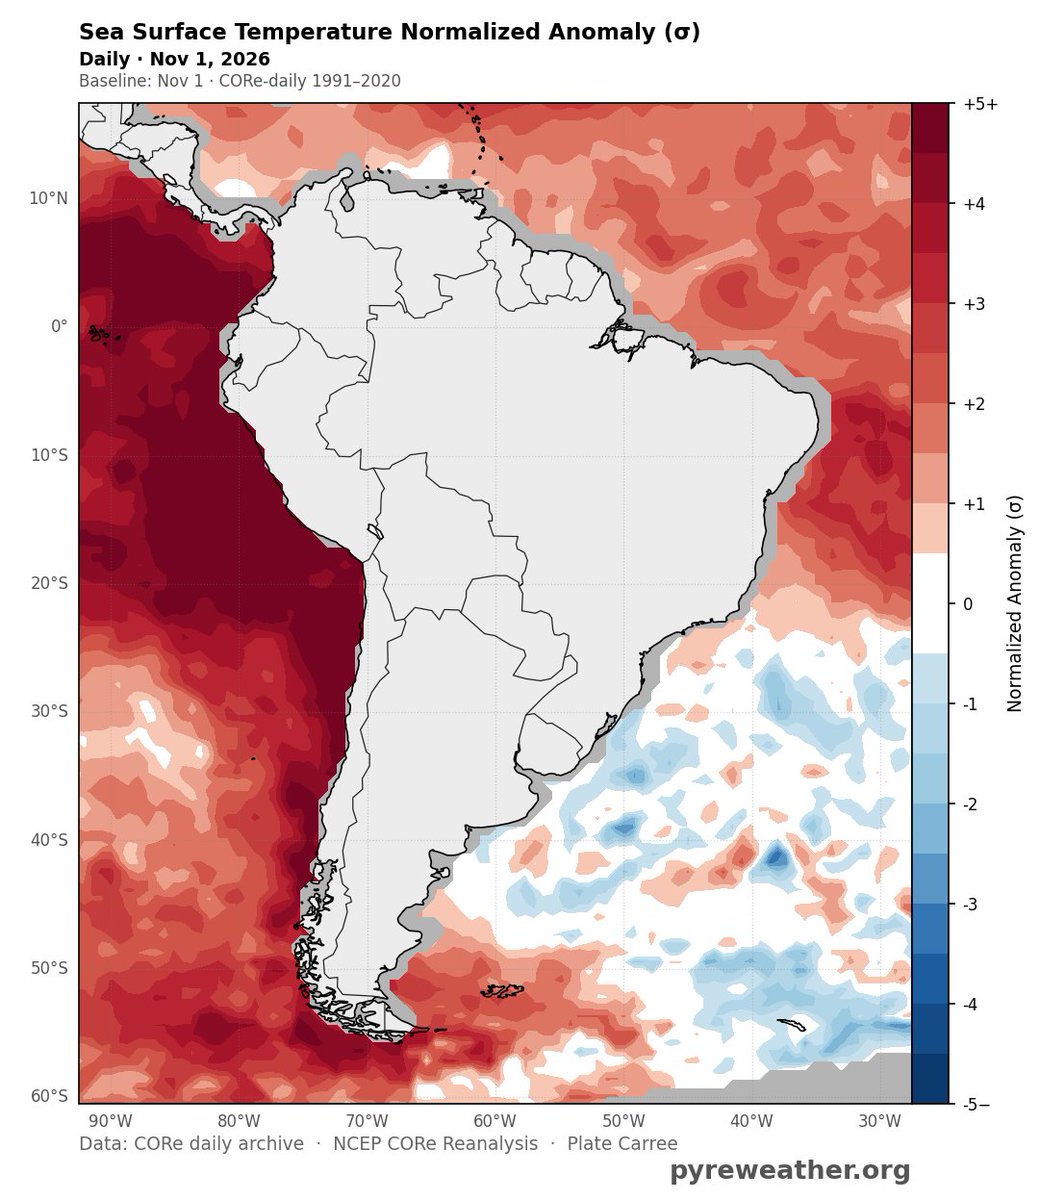
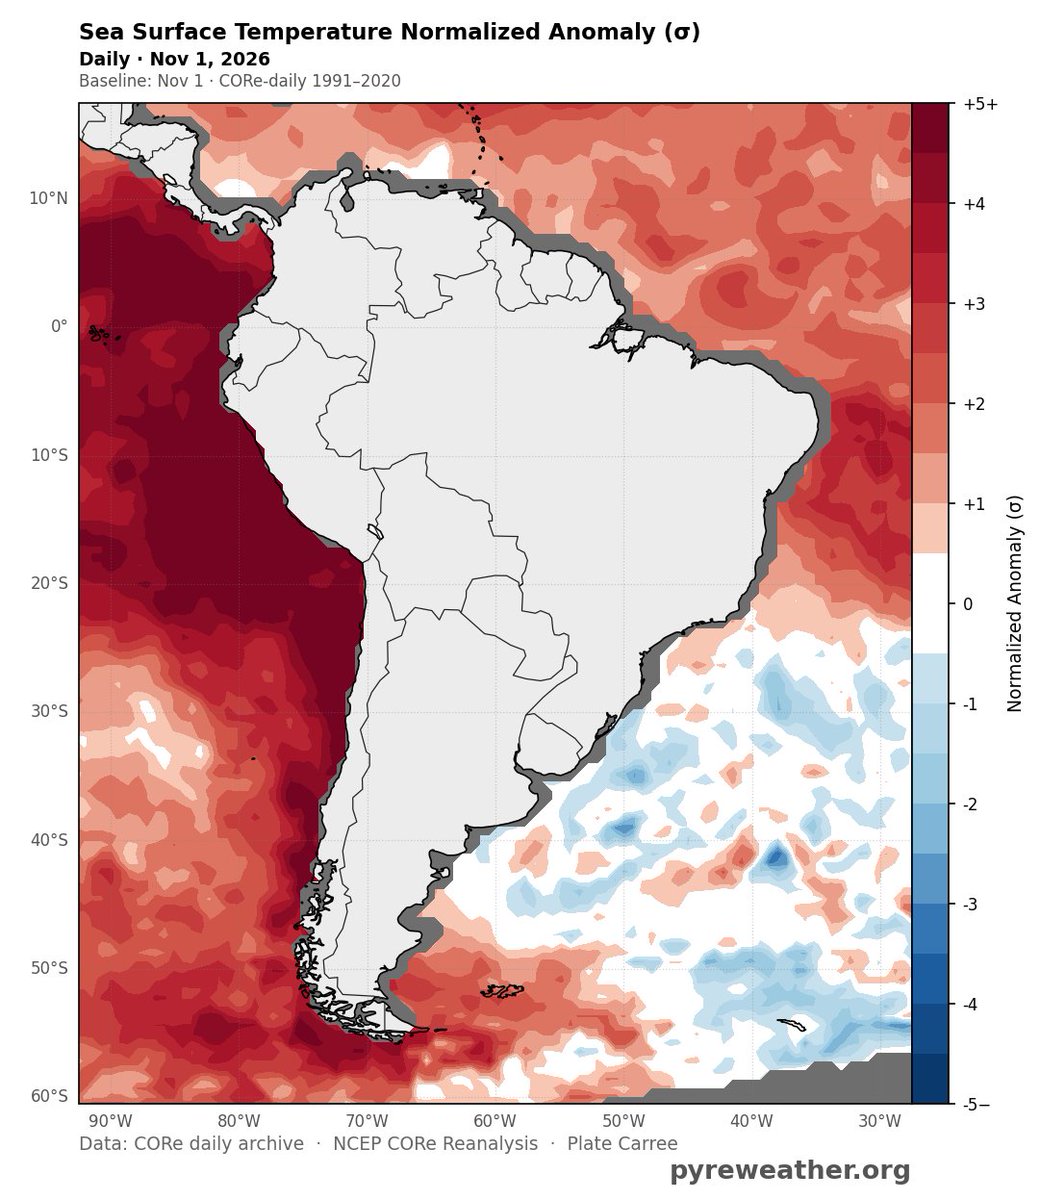
We need your input on dealing with CORe's data resolution of 0.7 degrees (tens of kilomters) and expectations when someone is viewing a map with coastlines for sea surface data.
There is a white border around most coasts. When making an anomaly map, 0 is also white.
(cont)
It has benefits, eg comparing 50s, 60s, 70sdata with 2010s & 2020s.
Just looking for input on what is less likely to be interpreted as the coast line gaps = 0 anomaly as opposed to zero data.
Images: Current (white around coasts on anomaly map) , proposed (gray around coasts)
Would filling the ocean with a darker gray than land imrpove readability or just add ink (pixels) where not needed?
This is an artifact of the data, and anyone using CORe will experience it.
CORe is not ideal for SST research, but when comparing to the past
(cont)
On the verge of a SSW event.
Oct 1–25: Strong westerlies in the upper stratosphere,Oct 27–Nov 6: Polar cap geopotential heights are strongly positive. Nov 1–10: Westerlies at 60°N weaken, esp. btwn 10 and 50 hPa. But remain positive (westerly), rather than reversing to easterly.
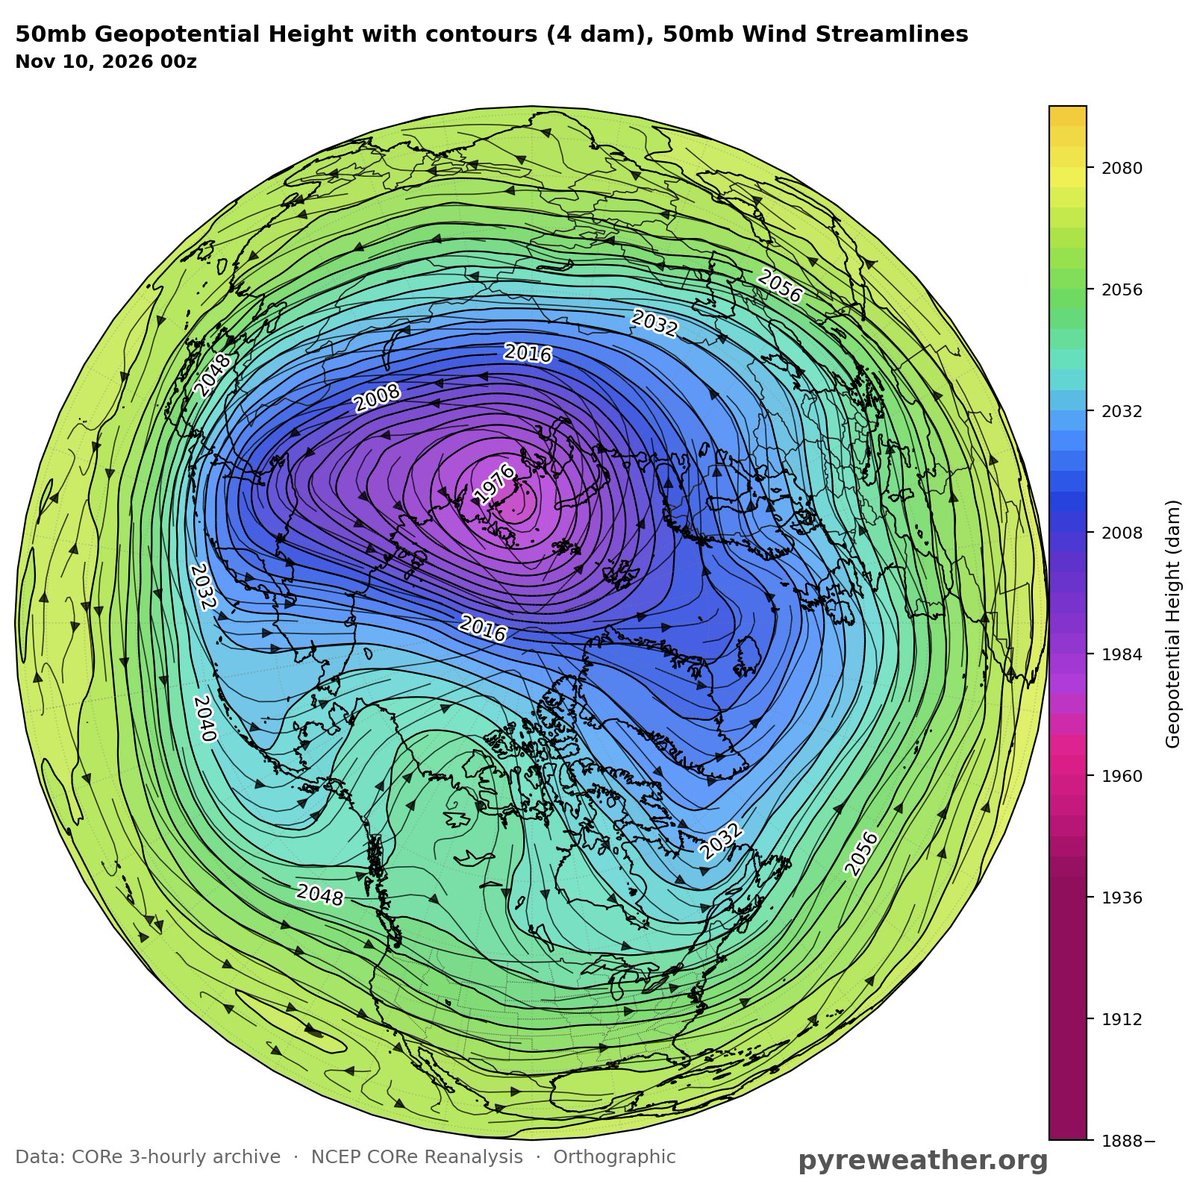
50mb GPH: There is a single, well-defined low-height circulation displaced toward northern Eurasia, not two separated vortex centers. A displacement-type disturbance, not a split.
10-hPa zonal wind: Strong westerlies along parts of the vortex perimeter, esp. over the North Atlantic–European sector. Easterly winds across portions of the polar interior. Consistent with a disturbed vortex, but no zonal-mean reversal required for a major SSW.
@Statisticizer@Heinekend9up Hmm....this is a 2m temp options with the color palate editable for all time-scales, but i did notice the the color bar which is clickable, has a delayed fill on my screen. So a slower or narrower connection may delay in loading this. Let me see if I can track down this issue
@Heinekend9up@Statisticizer Maybe I should. Make fot to data a default for these because there’s not a great way to know the span of the anomaly as a generic scale limit
@Heinekend9up@Statisticizer And one last thought, the CORe data for sea surface are gridded data at .7 x .7 degrees resolution. If you look at any shoreline wiht SST you'll see white splotches adjacent to coasts. this is just a limit of this specific dataset. When we add ERA5, we'll have less white ...