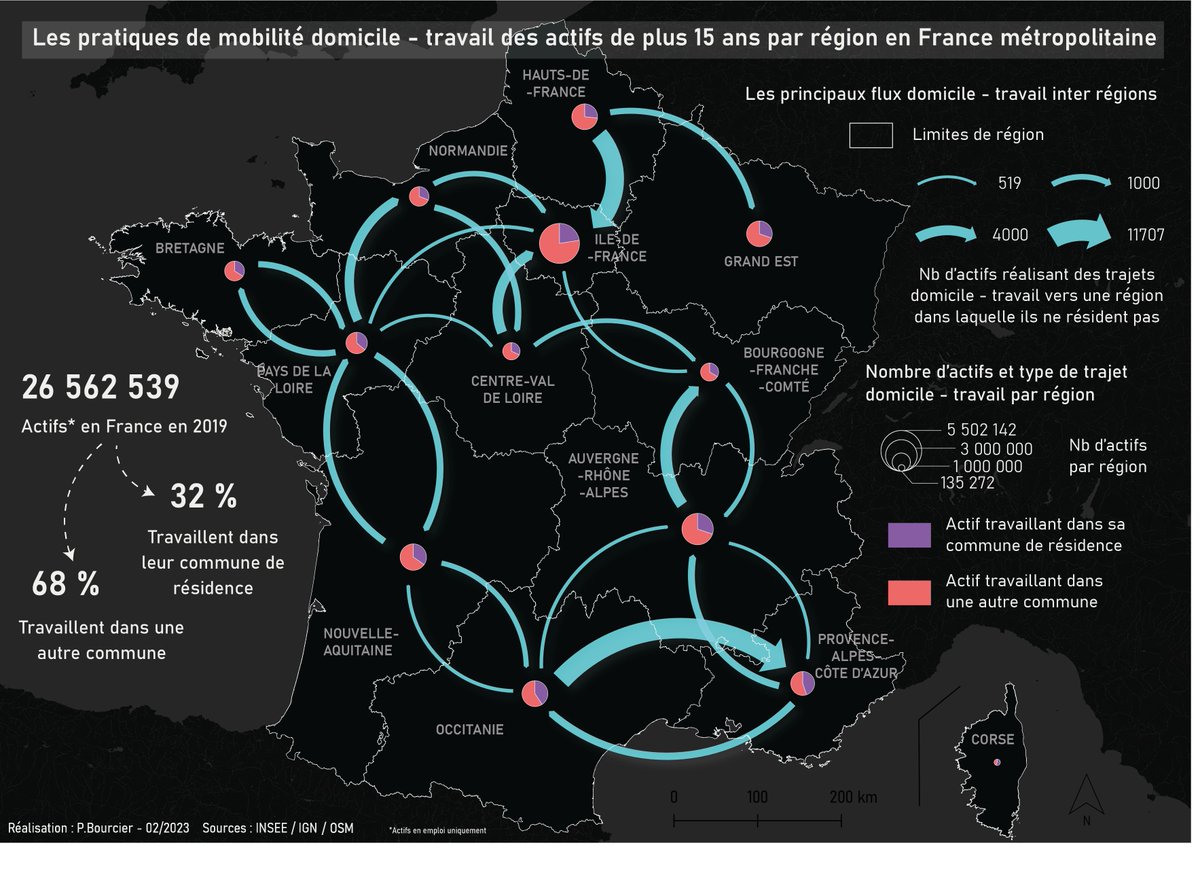
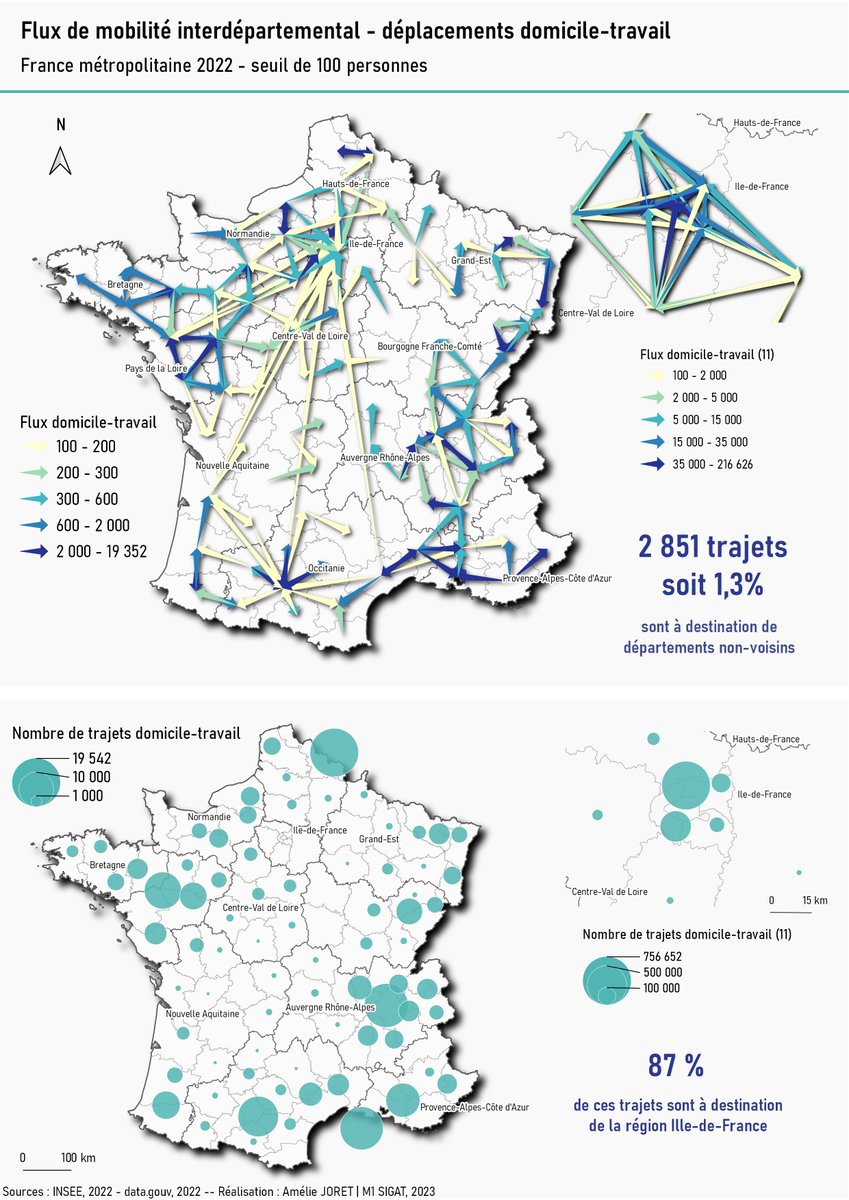
🎇Au master @E_Sigat , on aime les données de mobilités professionnelles de @InseeFr et les #cartes de flux !
➡Petite sélection subjective de cartes réalisées par les étudiants du M1 avec @qgis 😍
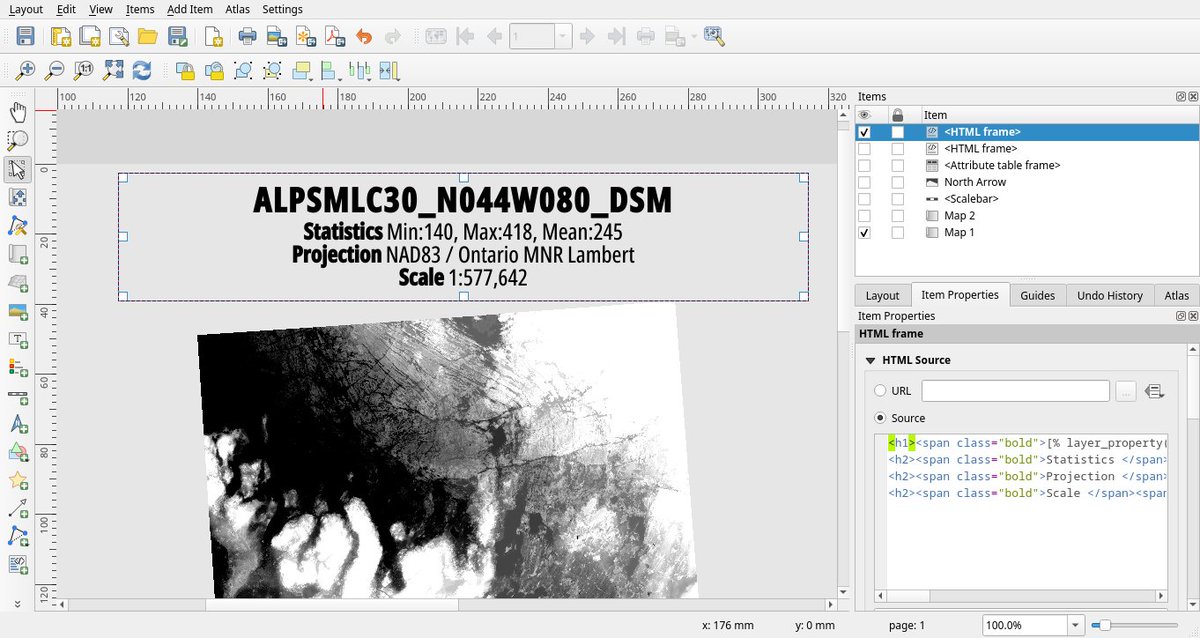
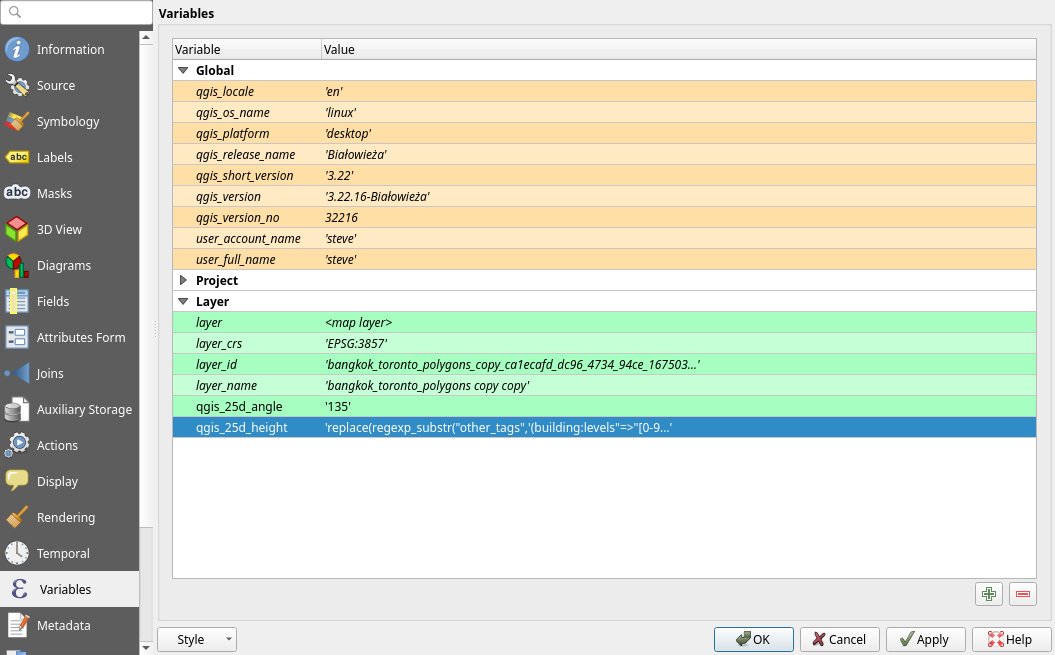
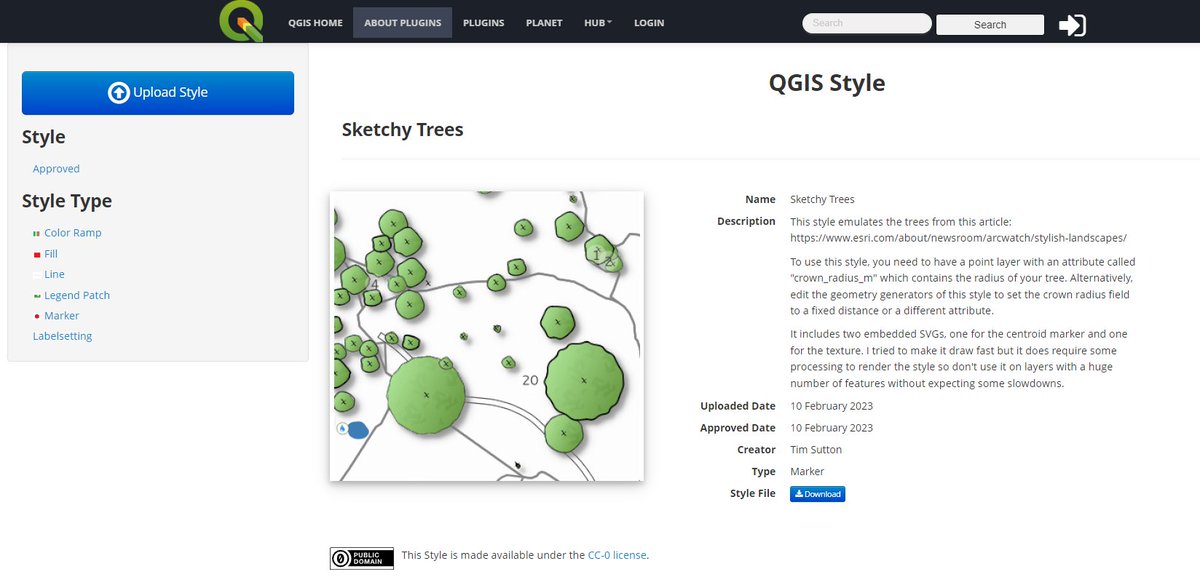
Wanna give @timlinux's map style https://t.co/JYPic08NBr a try yourself?
Nothing easier than that. Tim has shared his style on https://t.co/xtSmtwFins
#gischat#cartography#qgis
Yesterday we had a nice #QGISOpenDay session where @ihedelft MSc students in Water & Sustainable Development got useful tips to improve their catchment maps for the course Water Quality Assessment & Management. #qgis#qgishydro
https://t.co/TJuUeRYBT1
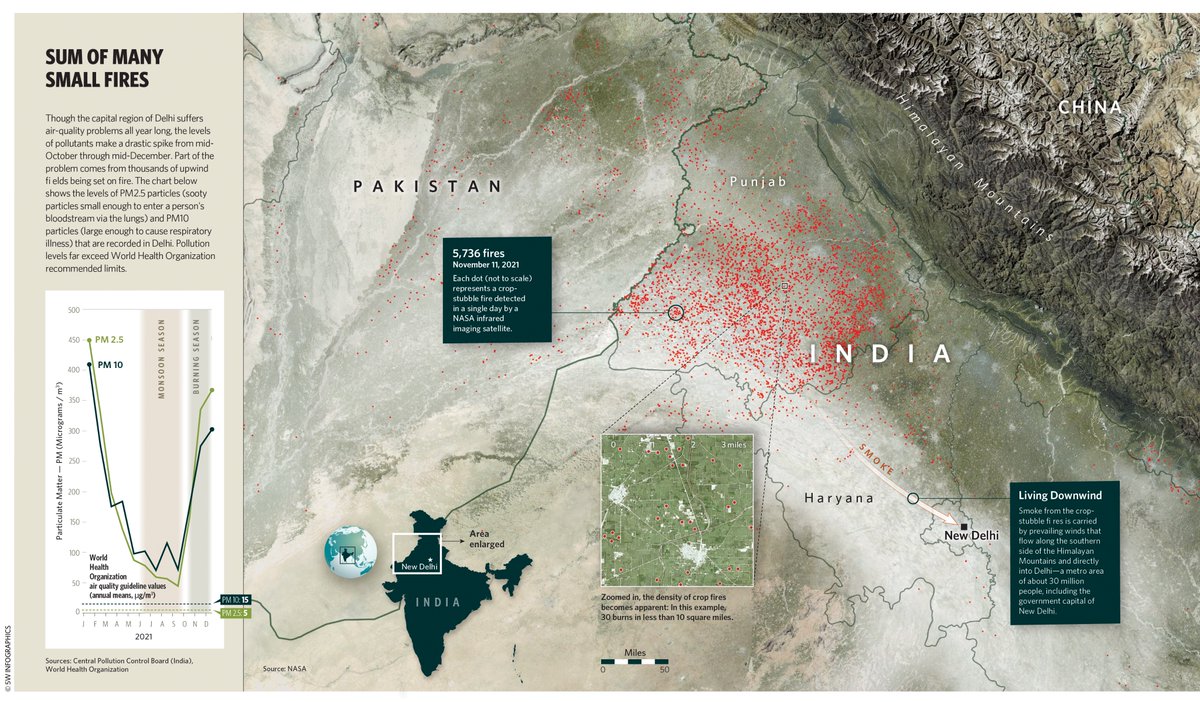
Every year from Oct. through Dec., smoke from crop-stubble fires is carried by winds along the Himalayas and into Delhi, worsening the already severe air pollution. For Nature Conservancy magazine. Illustrator, Photoshop, QGIS.
https://t.co/Ilrx5uxHfF
#infographics#maps#delhi
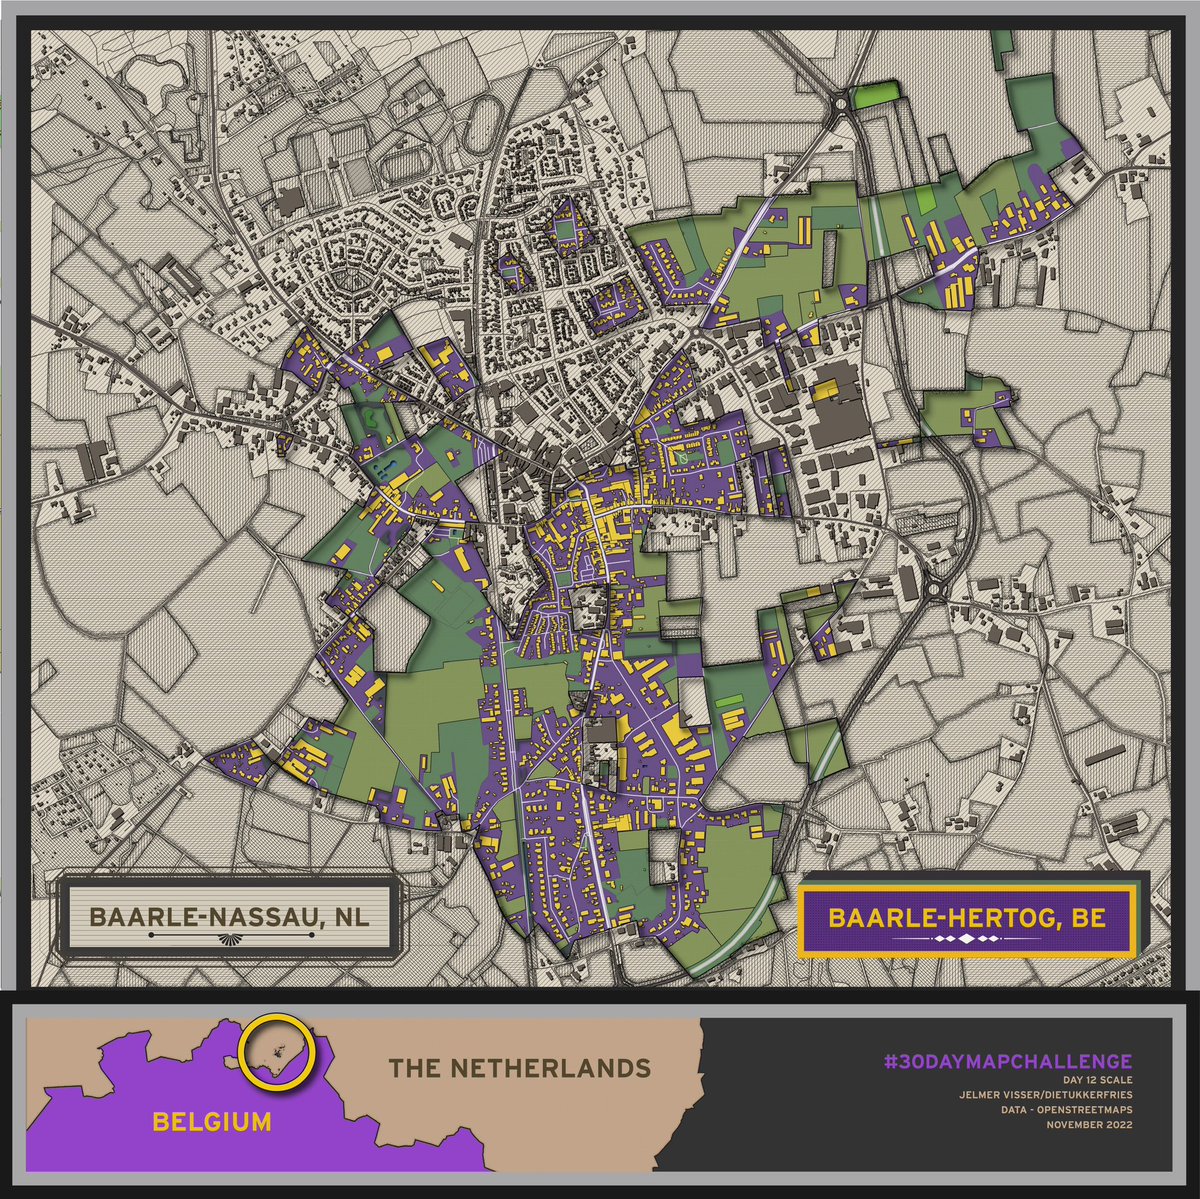
Bij elke kaart die ik maak, kies ik 1 van deze 2 finishing touch-methodes.
1 - na inladen/inkleuren vanuit QGIS exporteren naar Illustrator om een design ‘om’ de kaart heen te maken.
2 - door in QGIS om de individuele elementen/vlakken te tweaken (in AI zo goed als onmogelijk)
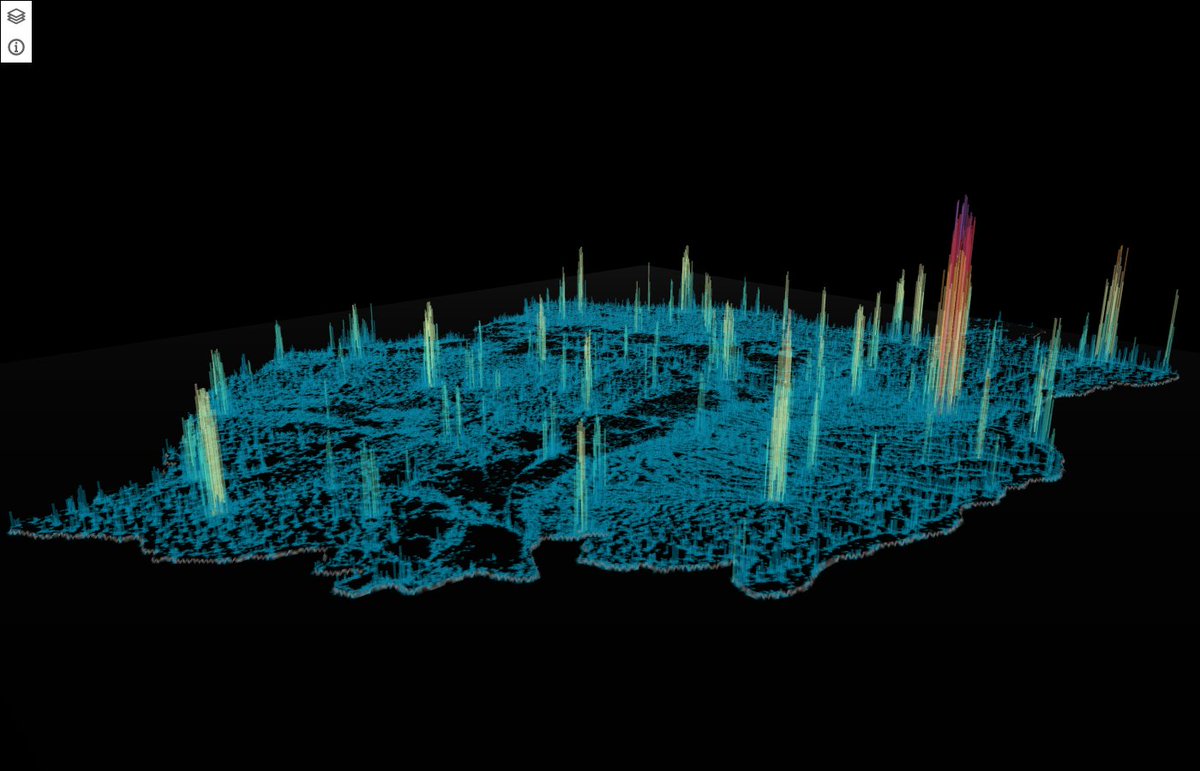
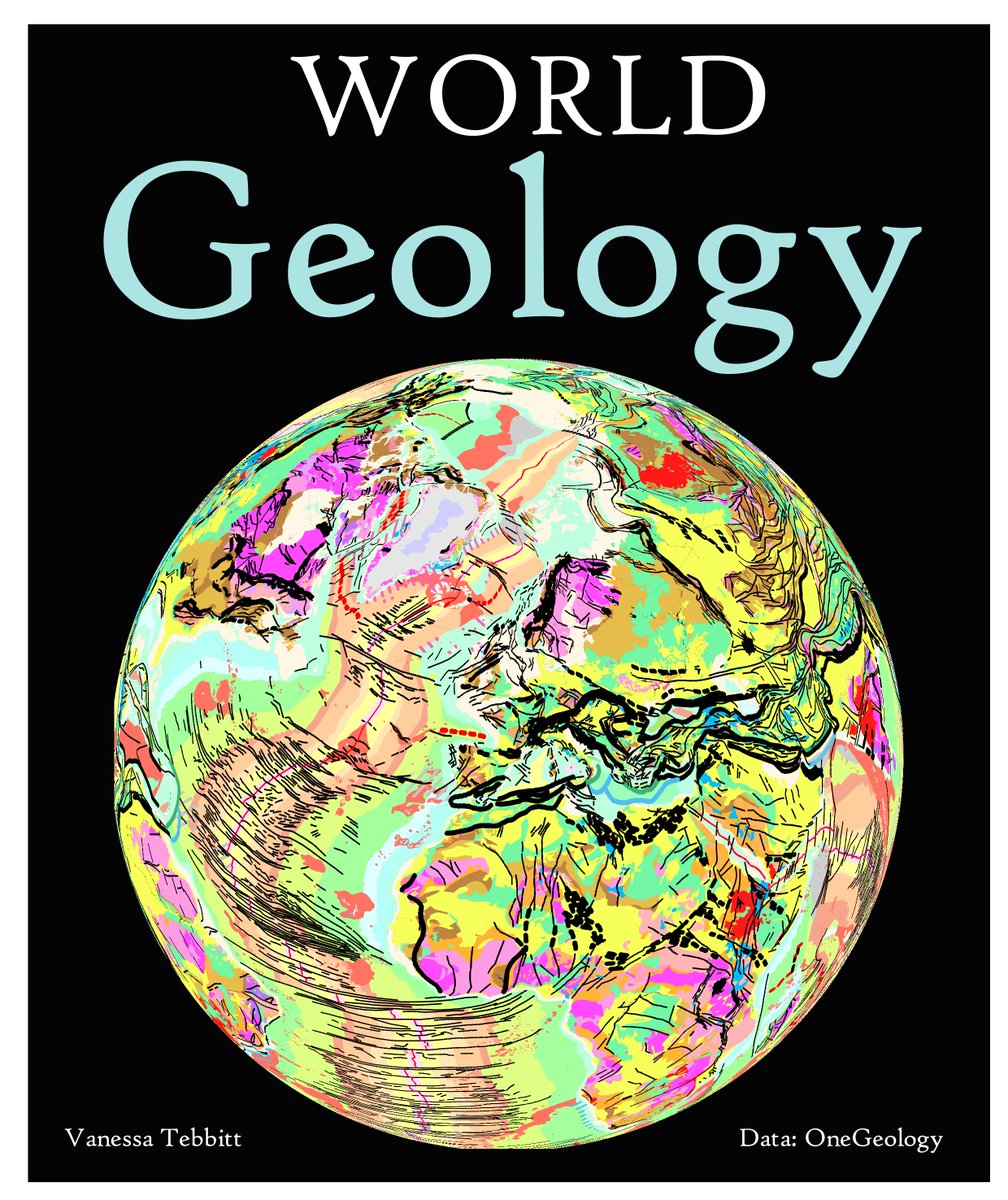
Geology of the globe in 80s style colour palette!
Day 19 - Globe #30DayMapChallenge
Made in #QGIS using the Globe Builder plugin.
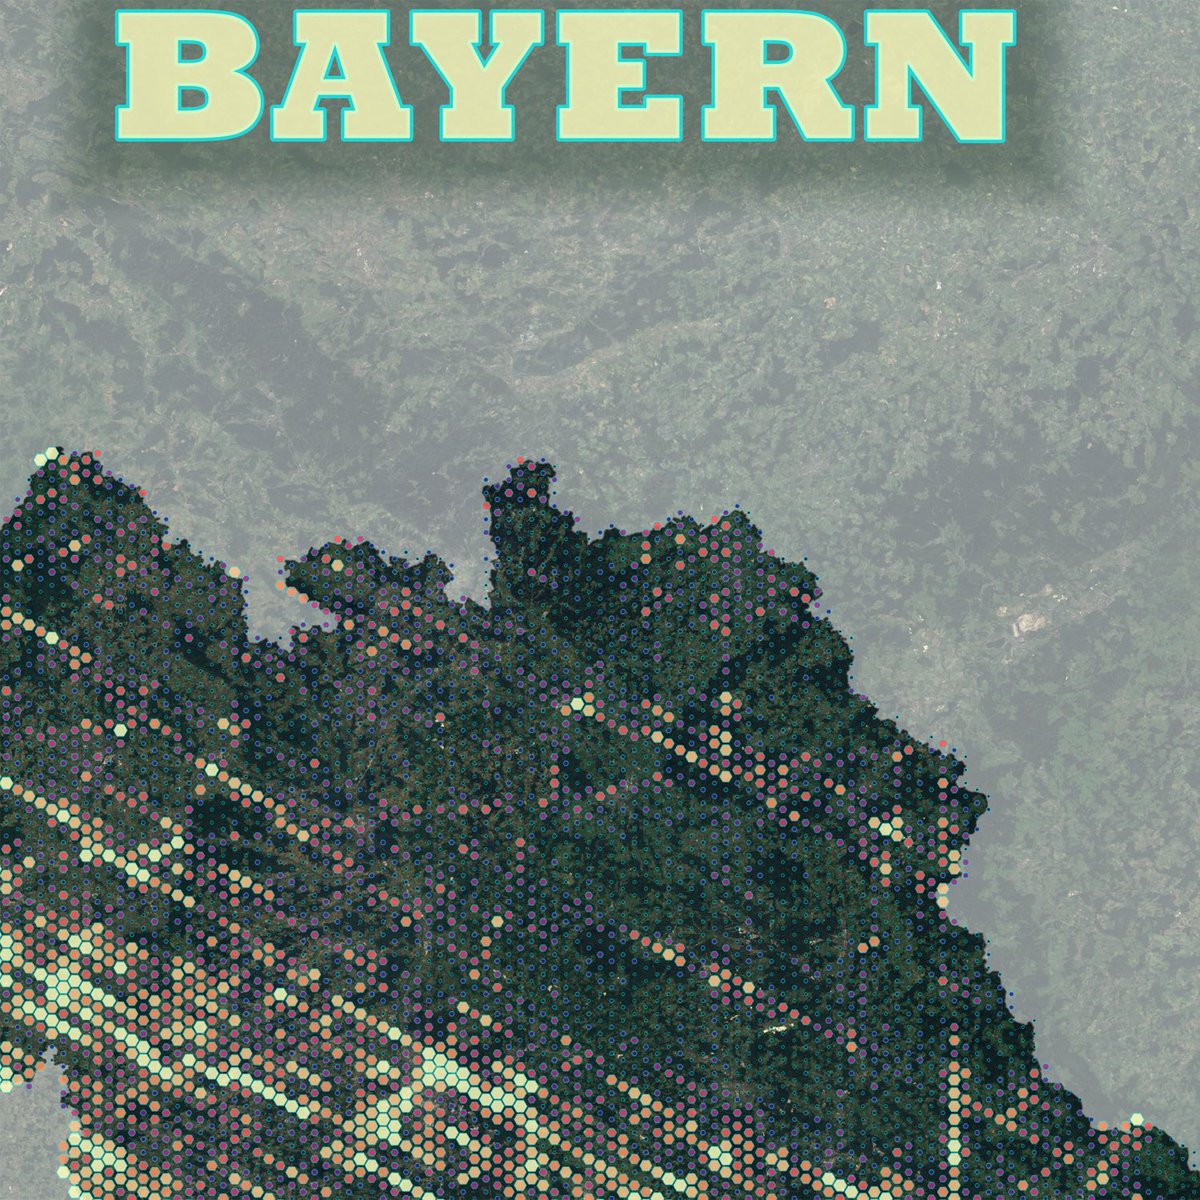
Was almost not going to make a map for today but...gotta..keep...going....😅🤣
Day 14 of #30DayMapChallenge - Hexagons
Trying new things and following @John_M_Nelson tutorial on color coded hexagons in varying sizes. All done #QGIS