Saw a #RRGchart Relative Rotation Graph somewhere but don't know how to read and interpret? Check out this @StockCharts ChartSchool article for a quick start.
https://t.co/CN2dz8QHmg
hi @granthawkridge sorry to be late to the X-game. Just noticed this post. The answer is yes. Been doing it for a long time. Here are some articles on the subject.
https://t.co/qEdsR0RwFa
https://t.co/2iNPjYjraz
https://t.co/z3VDUaV47u
https://t.co/rQgHwtymfy
https://t.co/Ic3u9ghJkb
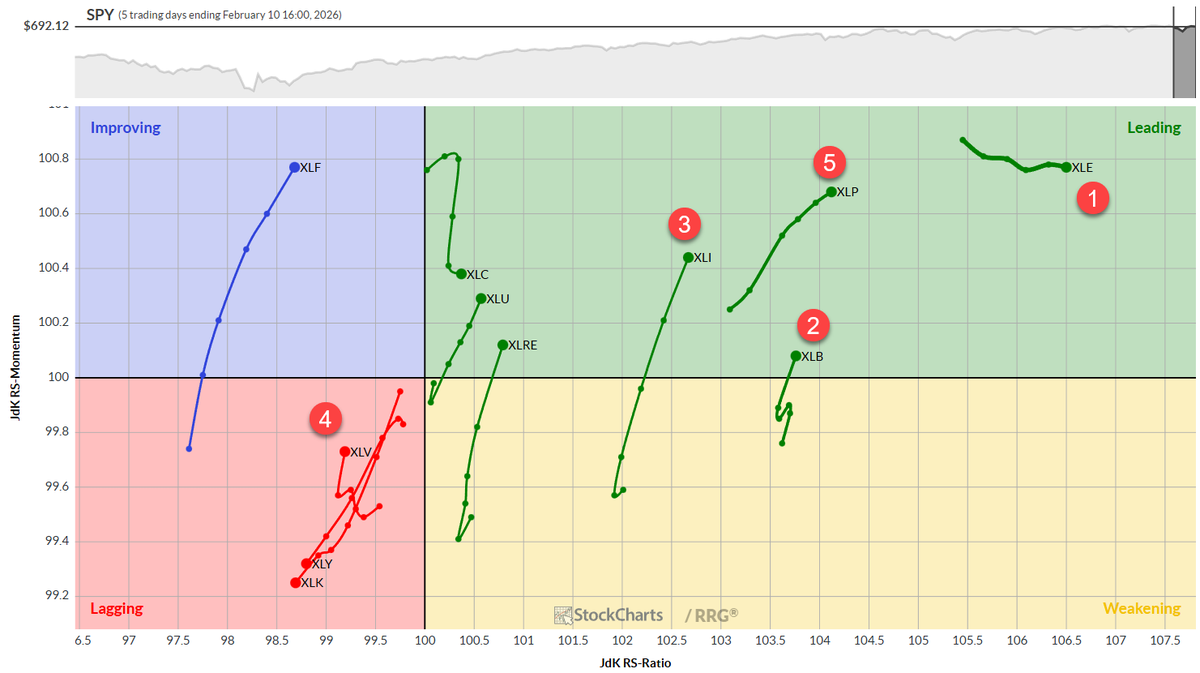
The Relative Rotation Graph shows improving momentum in Energy, Consumer Staples, and Healthcare, while Technology remains the clear market leader.
@davidsettle
Both the daily (5 days) & weekly (5 weeks) Relative Rotation Graph (RRG) shows $Tech as the only leading quadrant vs $SPX
However, the daily RRG does show $Energy $Healthcare & $Staples in the improving quadrant
Rotation is underway... and the short-term improvement is occurring in more defensive sectors
*Not a recommendation
@SchwabNetwork@SchwabTrading
That's an interesting rotation but a tough call. Given the high correlation of these 4 symbols I am inclined to say that USO will have to get back in-line with the others. On the other hand USO usually is the leading symbol and the others will follow. Based on the very high readings on the RS-Ratio scale I would go for a scenario where USO rolls over, which will confirm/support the loss of momentum in the other three. They all rotate through weakening and then come back up to leading. Initial weakness followed by a renewed rally
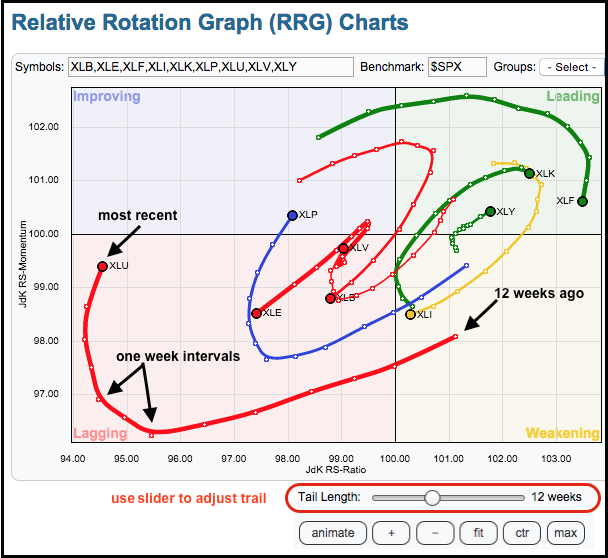
@RRGresearch The leading quadrant continues to be dominated by long RRG tails for Energy, Materials, Industrials, and Consumer Staples.
Read the full breakdown: https://t.co/ZfRdnC2NWi
> Energy remains the top sector, with materials ($XLB) and industrials ($XLI) following; consumer staples ($XLP) moved up, healthcare ($XLV) slipped, and real estate ($XLRE) made a notable jump.
> Weekly and daily #RRGchart analysis shows energy ($XLE), materials ($XLB), and industrials ($XLI) leading with strong momentum.
> Heavyweight sectors technology ($XLK), consumer discretionary ($XLY), and financials ($XLF) are underperforming and causing a drag on $SPY.
#SectorRotation #AssetManagement #Trading
https://t.co/njs7gQGsMl
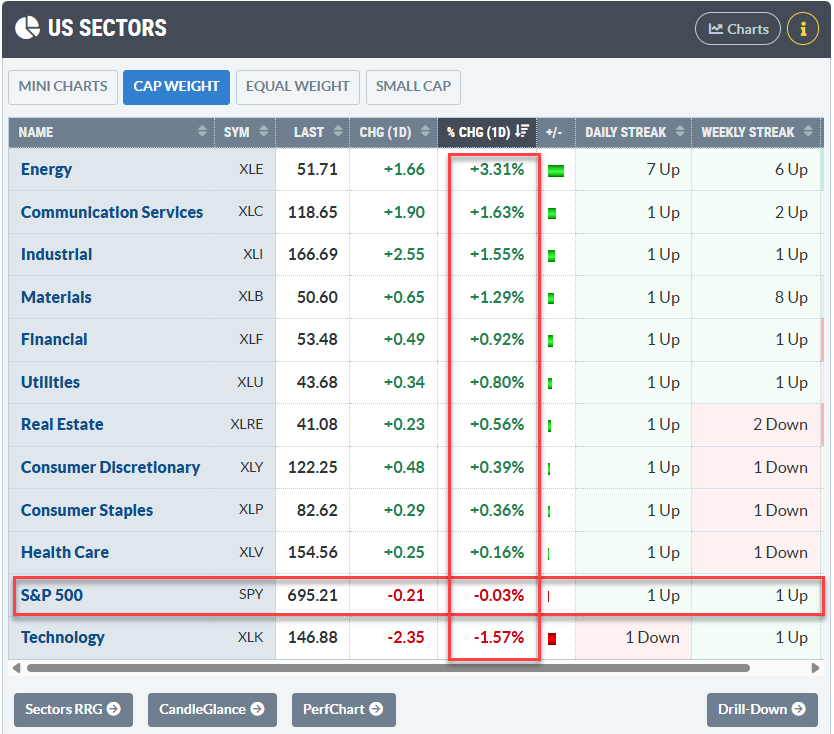
The Leaderboard Shake-up Big shifts in sector leadership this week! 📉 Technology ($XLK)andCommunicationServices($XLC) have dropped out of the top 5 for the first time in a long while. Energy ($XLE) has taken the lead, surging to the #1 spot and breaking out to new all-time highs.
https://t.co/wNMzTvqcTh
🏈 The Fantasy Stock Draft is BACK. 📈
@TomBowley & @RRGresearch are on deck first, engaging in a little back-and-forth before they step onto the field. Who do you think will win this face-off?
Register for FREE: https://t.co/tudMmG0s1s
@Mkts_Compass@Optuma This totally confirms that US listed (quoted in USD) ETFs tracking foreign markets should not be used to do "technical analysis" on that stockmarket ;) Use the underlying stockmarket index (in local currency) instead.