Exogenous Lactate, the preferred energy substrate. New post in @Glut4Science after 3 years!!
I hope you can enjoy the read of our journey behind ExoLactate and the science behind this potential fuelling solution! 🤓
Thank you very much for reading!
https://t.co/h6lUmJ1wBs
My updated metabolic map is less focused on substrate utilization and thresholds and more focused on metabolic stability. I believe the shift is subtle but important.
Instead of only asking:
“What fuel is being used?”
The model also asks:
“How stable is the metabolic system under stress?”
In this framework, lactate becomes the central proxy to understand the balance, drift, or overload of the metabolic system.
Approximate translation and comparison with different models:
• Zone 1 = low metabolic stress
Clearly below LT1/VT1
• Zone 2 = metabolic equilibrium
Near LT1/VT1, where lactate production and clearance remain tightly matched and the system operates at its highest sustainable balance
• Zones 3–4 = metabolic drift
The system progressively moves away from optimal mitochondrial matching capacity, even if lactate may still achieve a “steady state”…CP/MLSS/VT2/LT2/V4…
• Zone 5+ = metabolic overload
Above CP/MLSS/VT2/LT2/V4, where no true steady state is physiologically achievable
The key conceptual distinction:
A lactate steady state is not the same as optimal metabolic equilibrium.
The metabolic equilibrium ceiling is near LT1/VT1 and Zone 2.
The steady-state ceiling is CP/MLSS/VT2/LT2/V4.
Performance is ultimately defined by how long the body can preserve metabolic equilibrium.
The aerobic vs anaerobic model is not wrong because it’s simple. It’s wrong because it implies a switch where there is only a continuum.
Glycolysis is always active. Lactate is always produced and cleared. Mitochondria are always involved. There is no moment where the body “switches” from one system to another. What changes is the balance between glycolytic flux and mitochondrial capacity and lactate is the best real-time proxy of that balance.
I proposed in 2013 a model based on substrate utilization. Now I propose an update of that model built around four metabolic states. From metabolic equilibrium at Zone 2 all the way to metabolic overload, where the central question is not what fuel you’re burning, but whether the system can sustain balance.
Ultimately, the ceiling of equilibrium matters more than the ceiling of oxygen consumption.
👇
https://t.co/CWkZyRohzT
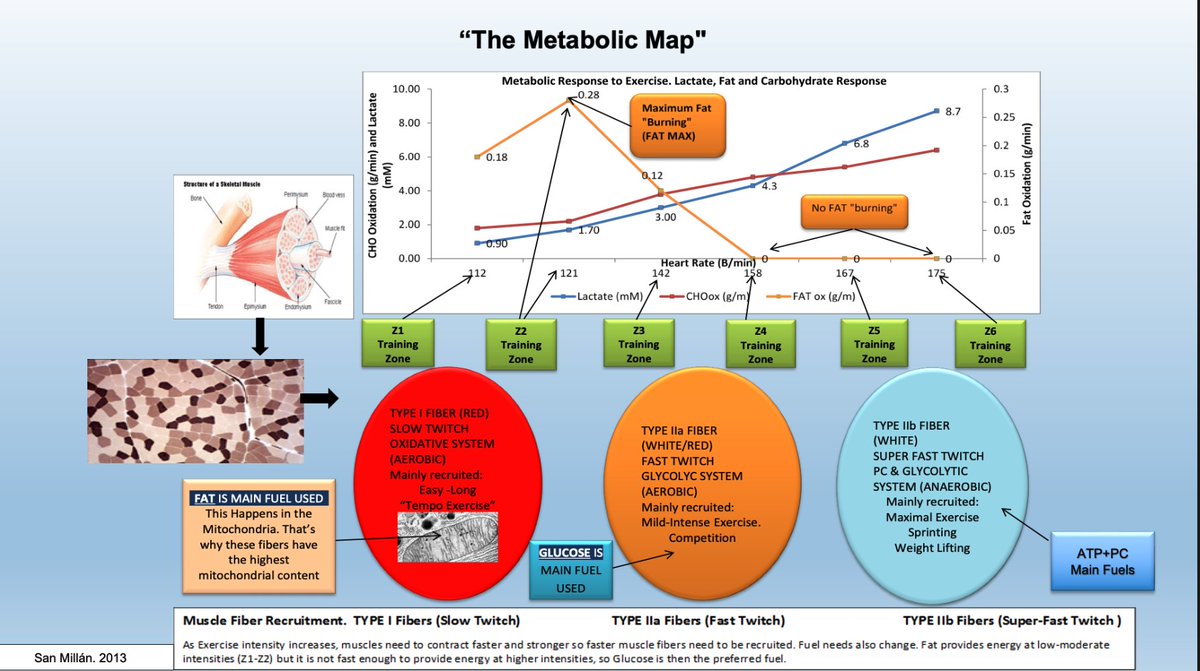
The original "Metabolic Map" I created in 2013 organized exercise metabolism around substrate utilization and muscle fiber recruitment, illustrating how the body transitions from fat to carbohydrate use as intensity increases.
This model helped me and many others translate complex laboratory findings into practical guidance for training and performance.
Now, I believe that it is time to evolve the concept..
Through years of research, as well as performance and clinical work with world-class athletes and patients, this has led to an updated model (2026), representing a conceptual shift.
Rather than questioning what the body burns, I began to question whether the system itself is in balance.
Exercise metabolism is reframed as a continuum of metabolic states, from equilibrium to overload, governed by the relationship between glycolysis and mitochondrial capacity.
Lactate emerges as a central proxy of this balance, reflecting the system’s ability to match production with clearance.
This concept and article have taken longer to articulate than anticipated, but tomorrow I’ll share the new model in my substack article.
https://t.co/KflYB7NpRG
After 30 years studying lactate, I have learned this:
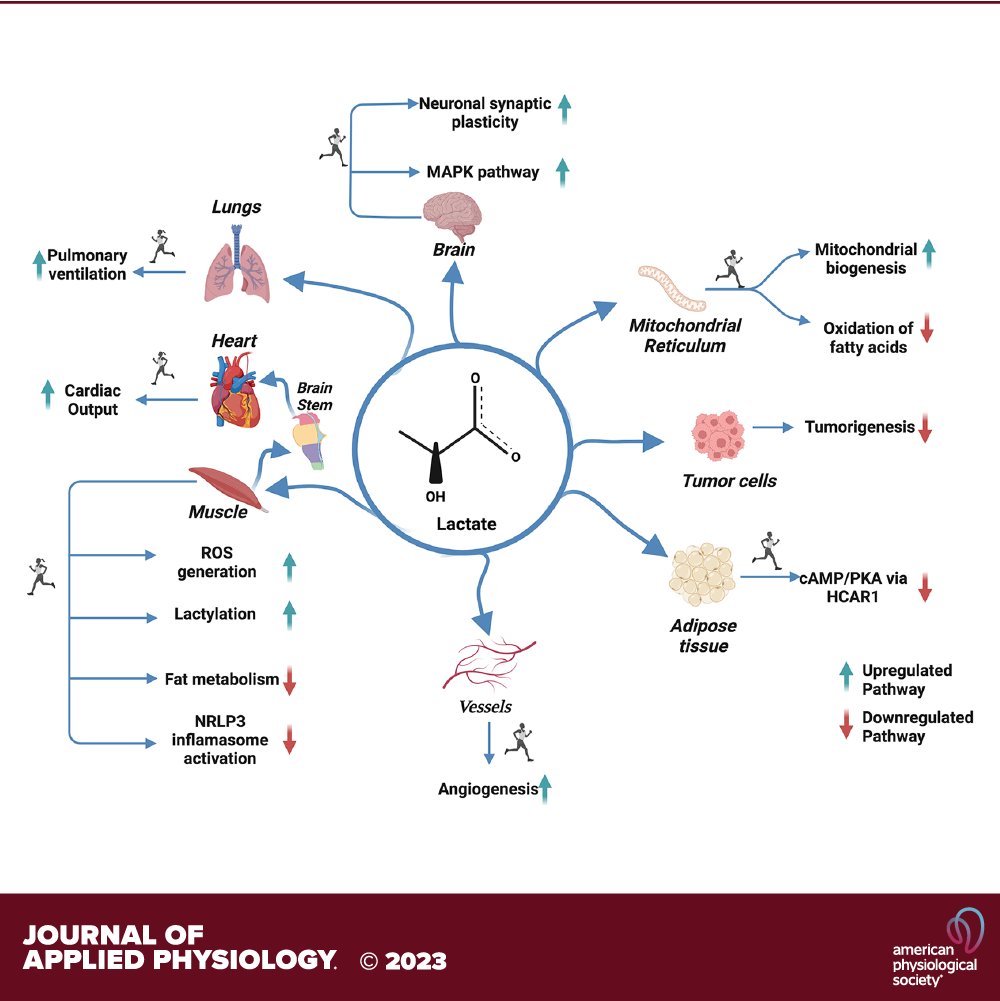
Lactate is not just a metabolite. It is a major regulator in the human body body.
It can support metabolic health or contribute to disease.
Same molecule. Different context.
Lactate has been the most misunderstood molecule in biology.
If you want to learn more about lactate and its multiple roles, link to my Substack article here 👇
https://t.co/WWDf5nntRm
VO₂max is not the whole story.
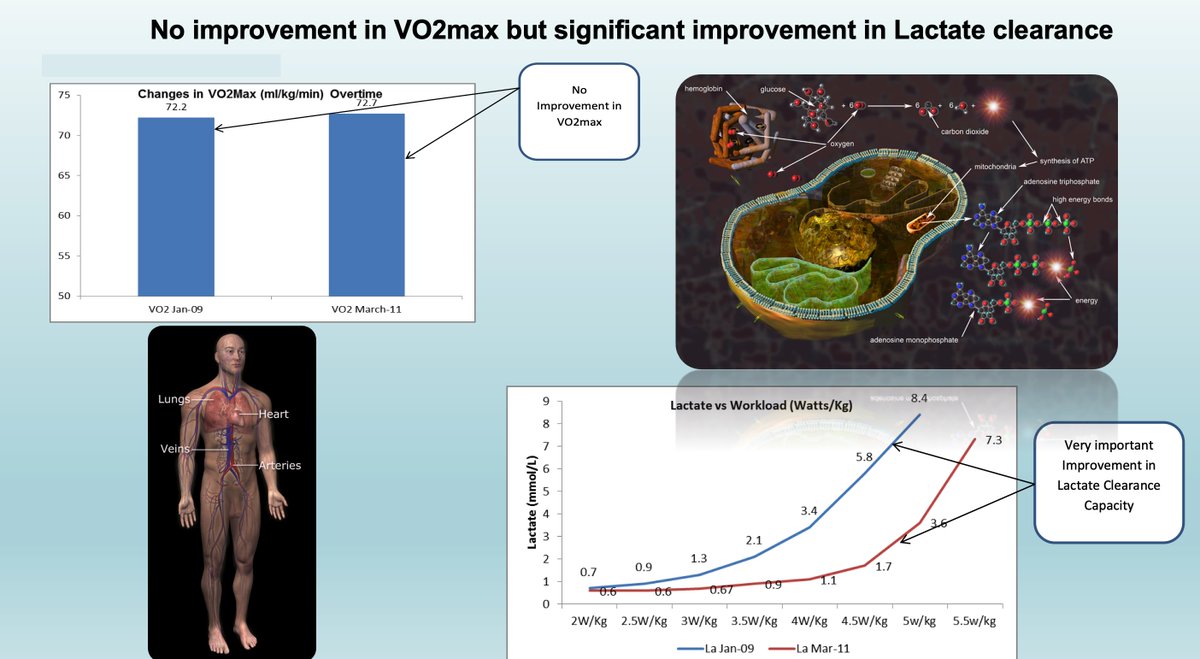
I’ve been showing this slide for the last 15 years.
Same athlete, 2 years apart.
VO₂max? Essentially unchanged.
Performance? From average to one of the best.
What changed was lactate!.
VO₂max reflects cardiorespiratory adaptations to exercise, the size of the engine: heart, lungs, and oxygen delivery.
Lactate reflects how efficiently that engine runs: mitochondrial function, cellular metabolism, substrate utilization, and metabolic flexibility.
At the same workload, markedly lower lactate indicates greater mitochondrial efficiency and improved lactate clearance capacity. In other words, better metabolism.
In elite sport, we’ve known for decades that VO₂max does not discriminate among top performers. Many athletes share similar VO₂max values, yet those with superior mitochondrial function are the ones who win. That difference is metabolic efficiency, and we assess it through lactate testing, not VO₂max testing.
Suddenly VO₂max is being crowned as the gold standard for longevity. But metabolic health is one of the main focuses of longevity. If that is the case, the most meaningful marker should also be metabolic and Lactate provides a more precise window into mitochondrial function. Furthermore, unlike VO₂max, Lactate allows us to individualize and prescribe exercise with accuracy, something we’ve been doing with athletes for decades
#lactate #metabolichealth #longevity
Durability is NOT high fat oxidation.
Durability is not purely a nutritional issue, but an interaction between metabolic strain (substrate depletion, mitochondrial demand), peripheral fatigue, and neuromuscular fatigue.
Fat oxidation correlates with endurance performance, but it does not determine durability by itself.
Late in long races, performance decline is not explained solely by fuel availability, but by the ability to sustain carbohydrate and lactate oxidation while preserving neuromuscular function under prolonged stress.
Lactate is a major oxidative fuel. Highly trained endurance athletes show greater lactate transport and oxidation capacity, which likely contributes to improved durability.
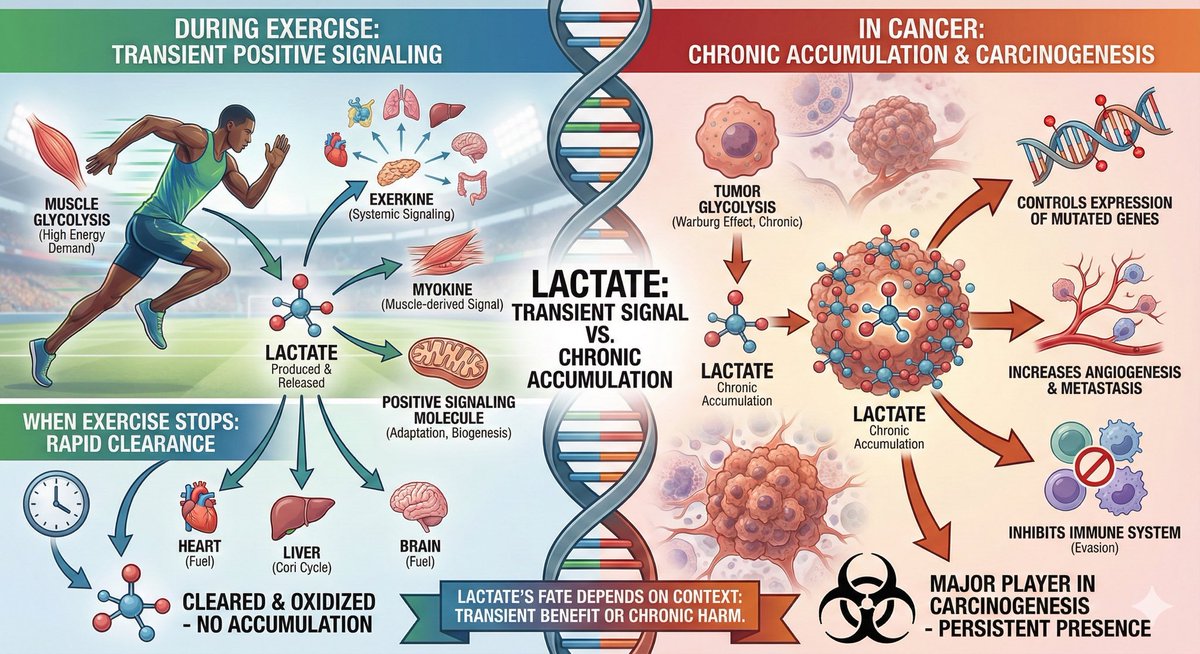
Lactate in Exercise vs Cancer: Same Molecule, Opposite Meaning
Lactate is not a waste product. It’s a central player in both peak human performance and tumor progression. However, the context defines its role.
🚴 In exercise, lactate is:
-A regulated byproduct of glycolysis during high energy demand.
-Mainly shuttled to slow twitch fibers and other tissues (heart, brain) as a preferred fuel
-A signal for mitochondrial biogenesis, improved metabolic flexibility and training adaptation
-Cleared efficiently via the lactate shuttle and mitochondrial lactate oxidation complex (mLOC). When exercise ceases, so does muscle lactate accumulation
🧪 In cancer, lactate is:
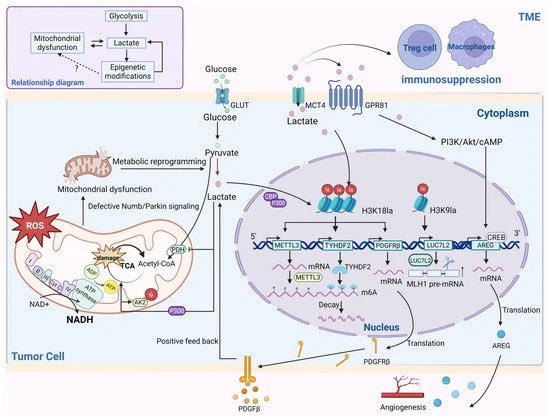
-The goal, not a byproduct (“lactagenesis hypothesis”, San-Millan and Brooks, 2016 https://t.co/yViJoMQV8u)
-Tumors intentionally upregulate glycolysis (Warburg Effect) to generate lactate even in oxygen abundance.
-Lactate accumulates in the tumor microenvironment, promoting:
*Angiogenesis (via HIF-1α)
*Immune evasion (T cell suppression)
*Invasion and metastasis
*Gene expression and Epigenetic remodeling (histone lactylation)
🏃♂️ In athletes, lactate is a both a key regulator and marker of performance as well as adaptation.
🧬 In cancer, lactate is both a key regulator and marker of aggression as well as poor prognosis.
Same molecule. Different fate. Opposite implications.
#LactateScience
#CancerMetabolism
#MetabolicReprogramming
#ExercisePhysiology
#MetabolicFlexibility
#WarburgEffect
👨⚕️Your heart can get older without you noticing.
Not in wrinkles. In stiffness.
A 2-year randomized trial in Circulation took sedentary adults ages 45–64 and showed something wild:
They made the left ventricle less stiff.
Here’s what changed after 2 years:
→ LV stiffness dropped 0.072 → 0.051
→ about a 29% reduction in stiffness
→ the control group didn’t change
Fitness climbed too:
→ VO₂max rose 18% (29.0 → 34.4 mL/kg/min)
→ controls stayed flat
And the “young-heart” pattern showed up:
→ the heart filled to a bigger volume
→ filling pressure didn’t rise
→ more blood pumped per beat at the same pressure
Now the part everyone wants: what they actually did.
The weekly plan
🛝2 easy aerobic days
→ 30–45 minutes
→ conversational pace
🙂1 long easy day
→ 60+ minutes
→ same conversational pace
😅1 interval day
Warm up 10 minutes easy
Then:
→ 4 minutes hard
→ 3 minutes easy
Repeat 4 rounds
Cool down 5–10 minutes easy
Hard means breathing heavy and you can only get out a couple words.
Technical target: by the end of each 4-minute rep, you’re near 90–95% of HRmax.
The day after intervals
→ 20–30 minutes very easy walking or light cardio
Technical target: <70% of HRmax and you feel like you’re recovering, not training.
Strength 💪
→ 2 short sessions per week
→ 20–30 minutes
→ full-body basics
That’s the structure.
Not “move more.”
Not “get your steps.”
The takeaway:
Middle age seems to be a “window” where the heart still has meaningful adaptability.
Not a promise. Not a hack.
Sedentary time quietly trains your heart to get stiff.
Structured training—especially with some real intensity—trains it back toward compliance.
Midlife still has enough “plasticity” to change the trajectory.
Waiting until the problem is established is the hard mode. Start now—your future heart will thank you!🌟
One of my most valuable learnings that has shaped how I understand metabolism:
👉🏼 “Stress doesn’t always mean adaptation, although stress is a condition to adapt.”
Applied to cellular level (⬆️PGC1α ≠ always ⬆️mito proteins) or organism level (⬆️training load ≠ ⬆️results).
The paper of the day.
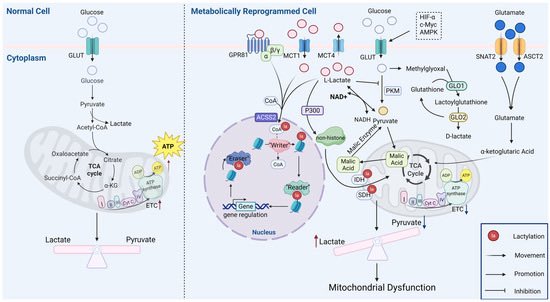
If you really want to learn about Lactate and its role as regulator of genes expression, this is a good reference.
https://t.co/XtWjbGnlV3
New study https://t.co/8eYstgEulq aims to identify reliable biomarkers that reflect training load and are suitable for personalising high-intensity exercise.
A simple guide to how mitochondria work. 4️⃣ primar jobs
Mitochondria are more than the “powerhouse of the cell.” They’re multitasking organelles that control energy, stress, genetics, and even cell survival. Here are the 4 primary jobs they do:
1️⃣ ATP Generation (Energy Production)
Mitochondria convert glucose, fats, and amino acids into acetyl-CoA, which enters the TCA cycle and electron transport chain (ETC).
The result: ATP, the energy currency for everything from nerve signals to muscle contractions.
🟢 Example: Every time you move or think, mitochondria are fueling the process.
2️⃣ ROS Balance - i.e., redox control
As mitochondria make ATP, they also generate reactive oxygen species (ROS) damaging byproducts.
Antioxidant enzymes (like catalase, SOD, glutathione peroxidase) keep ROS under control.
Too much ROS = oxidative stress → cell injury or death.
🟢 Example: Exercise trains mitochondria to better balance ROS, which is one reason it’s so protective.
3️⃣ mtDNA Maintenance (genetic stability)
Mitochondria have their own DNA (mtDNA), which encodes key ETC proteins.
Damage or mutations in mtDNA reduce energy output and contribute to diseases.
mtDNA mutations accumulate with age, linking mitochondria to neurodegeneration and aging.
🟢 Example: Mitochondrial DNA damage is a hallmark in Alzheimer’s and Parkinson’s disease.
4️⃣ Membrane Dynamics (fission & fusion)
Mitochondria constantly split (fission) and merge (fusion) to adapt to stress and demand.
This dynamic reshaping controls quality, removing damaged mitochondria (mitophagy) and keeping networks healthy.
🟢 Example: Impaired fission/fusion is seen in metabolic disorders and neurodegenerative disease.
Mitochondria don’t just make energy. They balance oxidative stress, protect genetic integrity, and constantly remodel themselves to keep cells alive. Supporting mitochondrial health means supporting the foundation of cellular life.