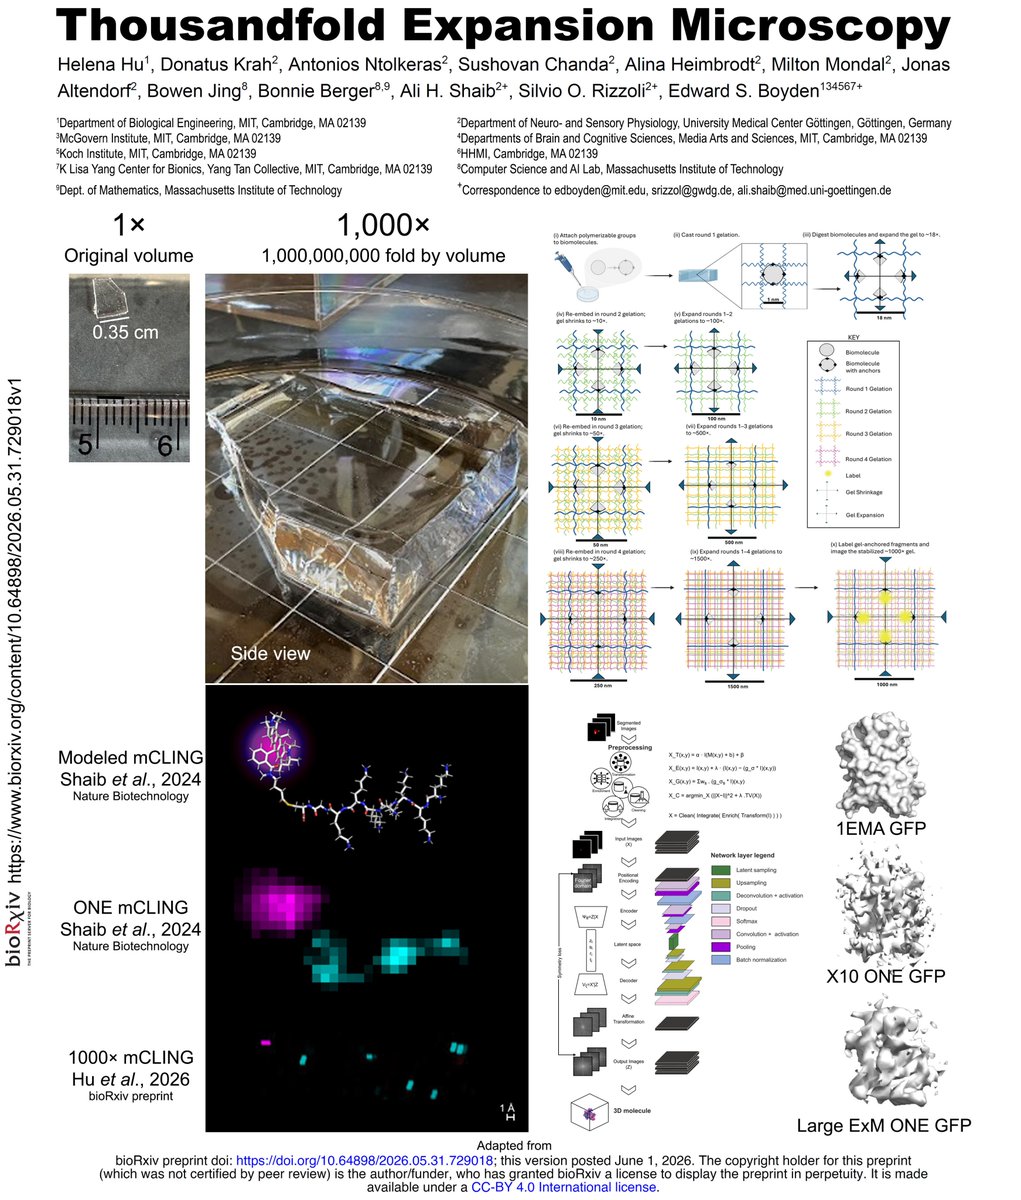
Hello world, meet 1,000× Expansion Microscopy.
1,000,000,000× expansion by volume! A gel that starts at a few centimeters will then expand to the volume of an Olympic swimming pool. https://t.co/E43kxx4O5M
In our new bioRxiv preprint, work carried out between MIT and UMG, led by Helena Hu in collaboration with scientists from the labs of @eboyden3 Ed Boyden, Silvio Rizzoli, and myself, we present Thousandfold Expansion Microscopy.
By enlarging biological specimens across multiple rounds of expansion, molecular-scale features, as small as the distances between adjacent amino acids, can be visualized with conventional optical microscopes.
Democratizing super-resolution microscopy.
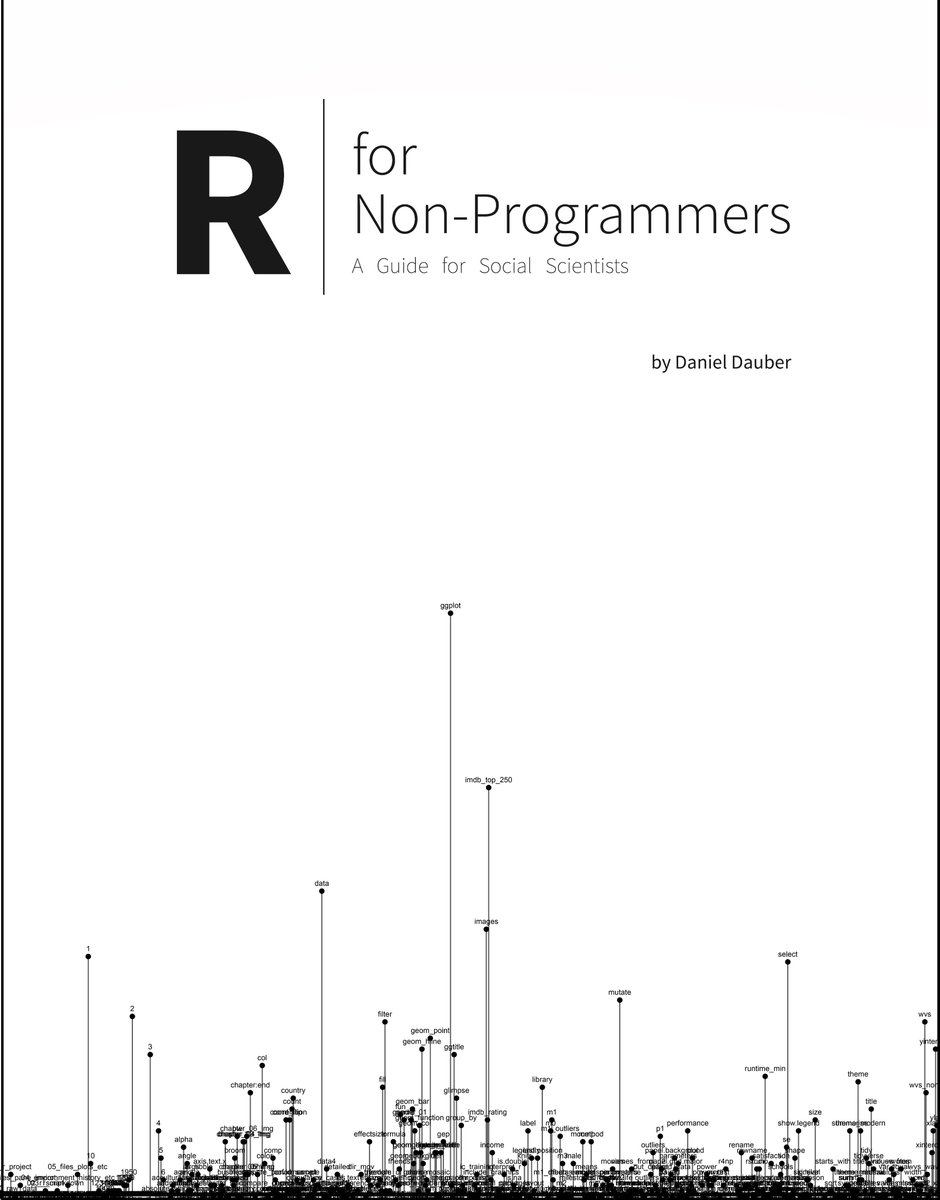
Visualizing gene structures in R? gggenes, an extension of ggplot2, simplifies the process of creating clear and informative gene diagrams, making genomic data easier to interpret and share.
✔️ Plot gene arrows to represent gene locations and orientations.
✔️ Visualize genomic features, including transcripts and operons.
✔️ Customize labels, colors, and layouts for clear presentations.
Whether you're working on genome annotation, comparative genomics, or molecular biology research, gggenes provides a flexible and user-friendly way to display complex gene structures with clarity.
The visualization shown here is taken from the package website: https://t.co/nutneLhvby
For a deeper dive into creating impactful visualizations with ggplot2 and its extensions, don’t miss my online course "Data Visualization in R Using ggplot2 & Friends!" Click this link for detailed information: https://t.co/ztlEzoEDWv
#RStats #Rpackage #DataAnalytics #ggplot2 #datastructure #DataViz
Congratulations 🎉 to @LiffnerBen
Thiago and @JVR_Lab. Take a look at our new article to see how we perform #UExM on Mosquito organs. https://t.co/z9t7jRtlZ5
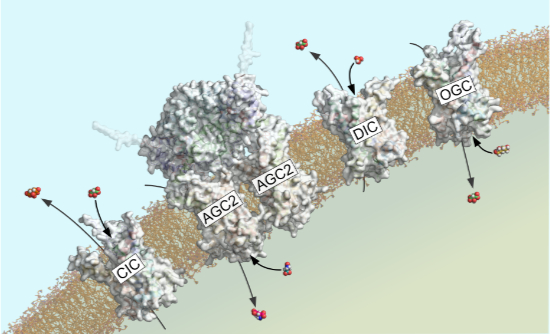
One in one out at the mitochondrial inner membrane!
Human mitochondrial carriers of the SLC25 family function as monomers exchanging substrates with a ping-pong kinetic mechanism
https://t.co/044kHgIQYC
🔬 The EMBO Practical Course 'Ultrastructure expansion microscopy' came to an end yesterday 🌟
Thanks to the participants and organisers of #EMBOExM for their invaluable contributions to the success of this course 🙏
Wishing you all the best in your future endeavors ✨
30-COLOR DNA-PAINT at 3D sub-15 nm RESOLUTION. We are overly excited to announce the publication of our latest work “Spatial proteomics in neurons at single-protein resolution” in @CellCellPress. Huge collaborative effort led by @EduardUnterauer. 1/9
https://t.co/w9BHydkC6B
Applications for this year's University of Glasgow Bioinformatics summer school are now open!!
If you want to know more about the wonderful world of genomics and transcriptomics, then come join us for a bumper one/two week odyssey.
https://t.co/OUWQpgrxvq
Just shared at @KeystoneSymp a new @ArcInstitute discovery of the bridge RNA recombinase mechanism: a new class of natural RNA-guided systems that retains the key property of programmability from RNAi and CRISPR while enabling large-scale genome design beyond RNA and DNA cuts
I'm super glad @drjomayPhd has made a youtube video video tutorial presenting my Visualization Toolset for #imageJ and #Fiji 🤩
Check it out there! : https://t.co/JT06yegEc9
and happy #FluorescenceFriday
.
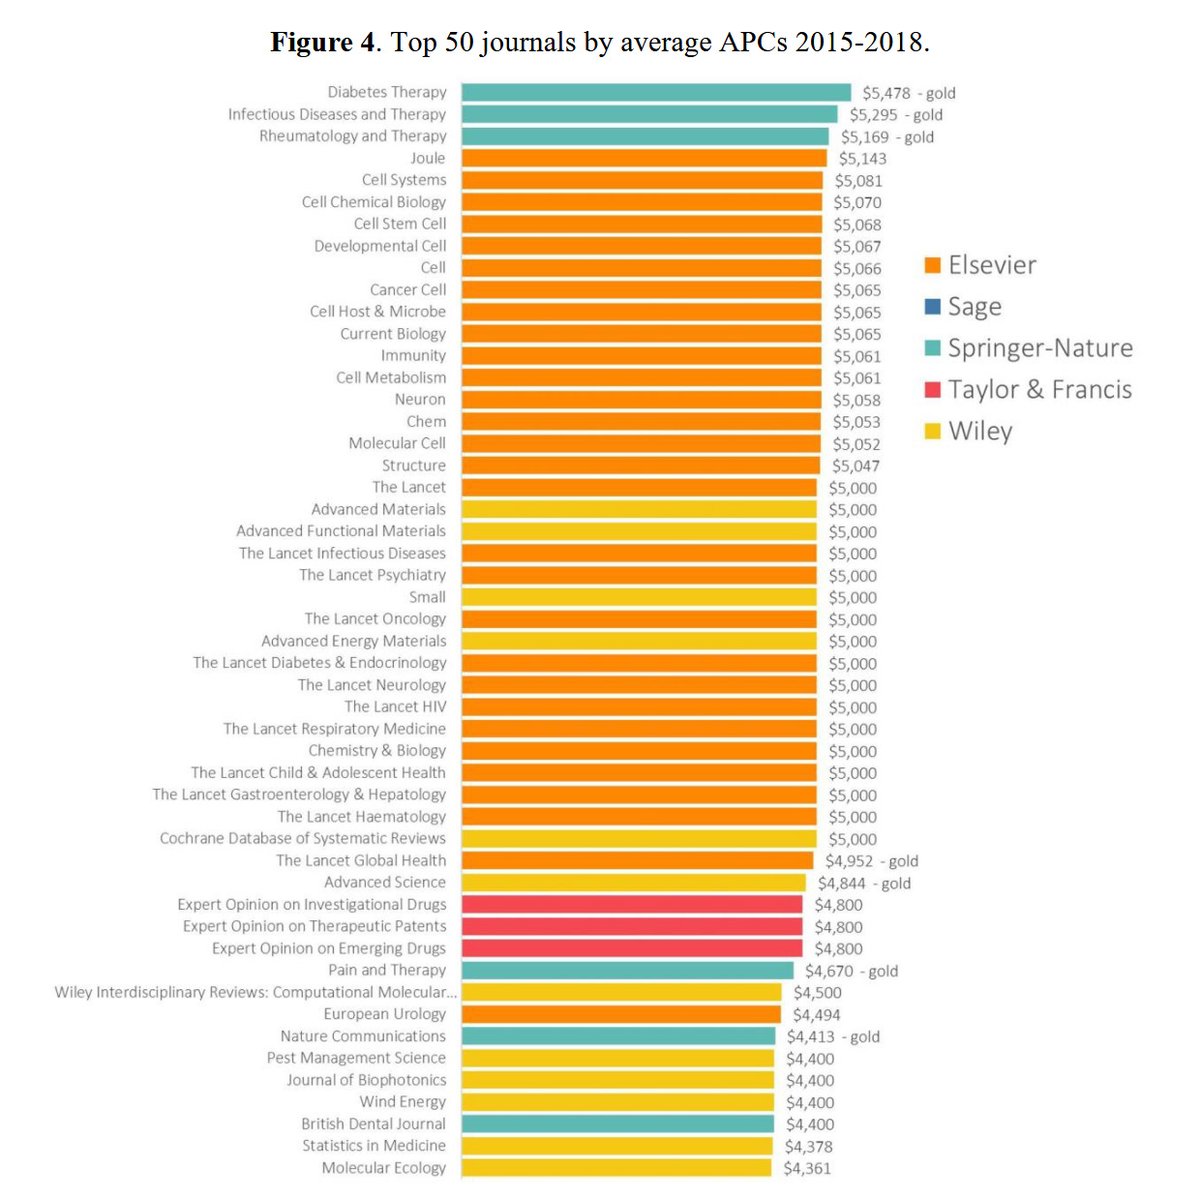
How the Big Five Academic Publishers Profit from Article Processing Charges
Spoiler alert : Their revenue was over US$ 1 billion between 2015-2018
A recent paper looks at the "big 5" publishers (@ElsevierConnect, @Sage_Publishing, @SpringerNature, @tandfonline and @WileyGlobal) and estimates their revenue from Article Processing Charges (APCs).
Here are the messages we took from the paper:
1⃣ Between 2015-2018 it is estimated that authors paid $1.06 in publication fees to these five publishers.
2⃣ Springer-Nature made the most revenue ($588.7 million) followed by Elsevier ($221.4 million), Wiley ($114.3 million), Taylor & Francis ($76.8 million) and Sage ($31.6 million)
3⃣ The data was collected from @Clarivate, @unpaywall, open datasets of APC list prices and historical prices retrieved from @waybackmachine.
4⃣ The APC's used in their calculations were based on those used in the year the paper was published. This is to be applauded. It would have been MUCH easier to take the current APC's but this would over estimate the revenue.
5⃣ To give an example of how the APC's could have been over estimated, a Wiley journal, in 2015 charged $3,000. In 2023, the fee is $4,020. If you used today's fee for a 2015 article the over estimate would be 34%.
6⃣ The number of #OpenAccess articles over the four year period of study (2015-2018) increased from 91,375 articles in 2015 to 153,746 articles in 2018.
7⃣ Over the four-year period studied, it is estimated that Scientific Reports obtained $105.1 million in APC's and Nature Communications obtained $71.1 million. These journals are both published by Springer-Nature.
8⃣ The high income of Scientific Reports can be partly explained by the fact that it published 73,206 articles.
9⃣ Three Springer-Nature journals had the highest average APC's; Diabetes Therapy ($5,478), Infectious Diseases and Therapy ($5,295) and Rheumatology and Therapy ($5,169)
🔟The three countries that paid the largest amounts of APC's were USA, $184.7 million; China, $148.0 million and the UK ($134.6 million)
You can access the article here: https://t.co/ZaCHuyRMUF
Tag: @mitpress | @LeighkButler | @l_matthia | @marcandresim | @philippemongeon | @stefhaustein