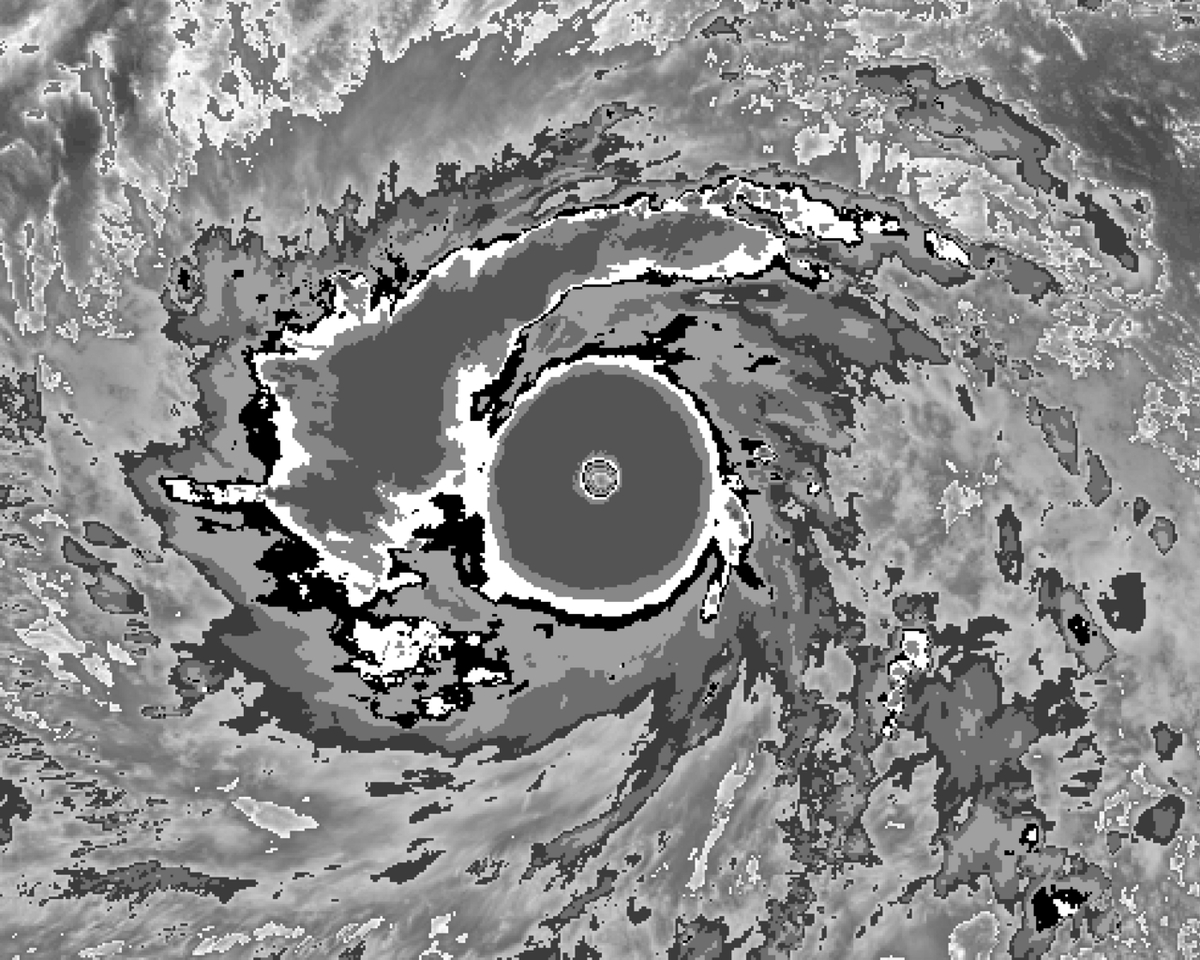
@sophiashines3@BackpirchCrew At landfall, it is officially the lowest recorded pressure (2nd worldwide behind Labor Day 1935). But there was a measurement of 878 mbars when Meranti passed over Itbayat, PH. In general sense including every typhoons in Pacific with or without landfall, it isnt among top 25.
@JonnyTheWX@ContentWxGuy@EliThePitBull Well Bopha is unlikely the strongest of 2012. There is Sanba. I'd argue the start of new wave of strong WPAC typhoons is 2009 (although WPAC most likely had a C5 every year since 2000, except 2017). Nida, Megi, Muifa, and Sanba are most likely stronger than Bopha.
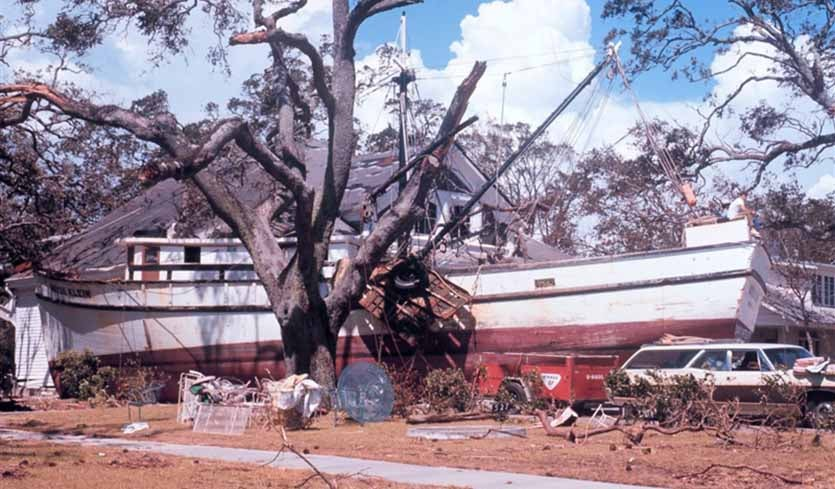
@AndreaDona60@BackpirchCrew Well you are arguing against the data by NHC as well. And when did the damage in the first photo 1 become worse than the one in photo 2 (which is indeed from a 195 mph storm)
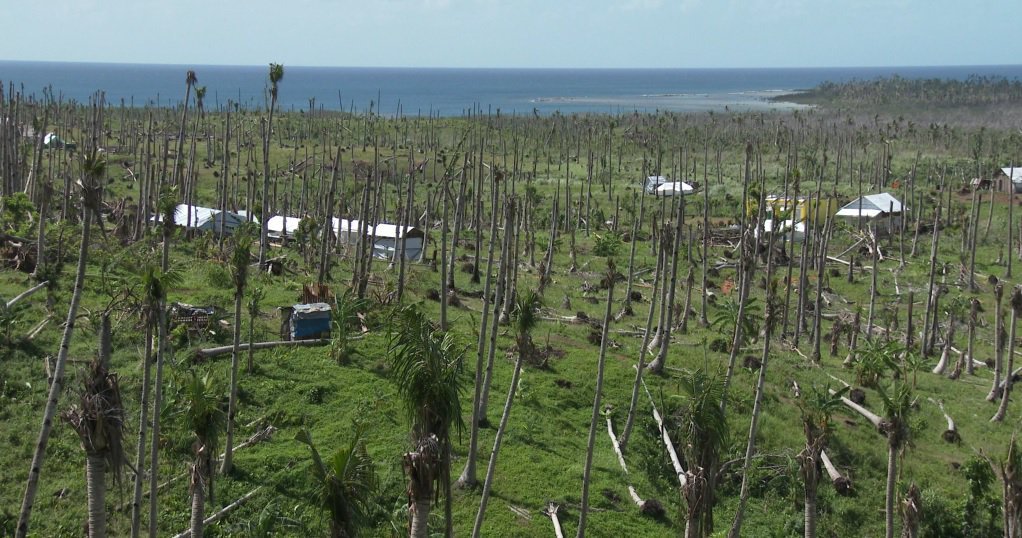
@AndreaDona60@BackpirchCrew Look at the house and the trees. That is not 225 at all not even 190. Haiyan's damage in Guiuan in Philippines is what 190+ winds damage look like
@AndreaDona60@BackpirchCrew NHC didnt use that to represent the landfall intensity because many factors may have lead to that reading (e.g. elevation, structures around it, the anemometer itself etc). They even downgraded it from 190 -> 175.
For reference this is what 195+ mph damage looks
@AndreaDona60@BackpirchCrew It is impossible it is indeed 225 mph. Wind damage doesn't even support 190 mph. The anemometer may have been elevated or experienced funneling effect
@IPTCWCDirector@zeb199818 2026 now has a 160kts and a 155kts storm. To date 2015 has 150/140/140, 1997 has 145/140, 1982 doesn't even have any C5 to date.
@McManusWx@xiaoqianWX@IPTCWCDirector There are apparently two signals for another long tracker behind Bavi (according to FNV3 now). This could put 2026 ahead of 1997, and on par with 02/04/15. 1997 is actually around top 10 but not very high on ACE rankings to date up until October when they went far and away.