In my #rstatsnyc talk, I introduced dbcooper, which turns any database into an #rstats package 📦
Great for creating internal company packages, or exploring a public database
Package: https://t.co/4So0E3snK9
Slides: https://t.co/DulgtqZwKp
Life-expectancy drop in 2020 compared to previous years. Another look at the results of our forthcoming IJE paper. @OxfordDemSci@CPop_SDU#rstats Code: https://t.co/7O1wf1Pi6j
The 2020 decennial Census redistricting data are now available in the dev version of tidycensus! Install with `remotes::install_github("walkerke/tidycensus")`, then use `year = 2020` in `get_decennial()` to get started #rstats
Assume you are using `data.table` package for the following operation. How many columns will `D1` have after executing following code? [see_image_1] #RStats#DataScience [TimeStamp:17092021123049]
I'm delighted to present 'ggHoriPlot', a user-friendly and highly customizable R package for building horizon plots in #ggplot2.
https://t.co/pqxEEKuwlr
Plot data compactly and expand your horizons using 'ggHoriPlot'! Thread below 🧵👇 #RStats#DataScience
For this #TidyTuesday I analyzed the most common music genres of the songs that appeared in Billboard Hot 100 each decade. 📊🎷
(only took the first genre that appeared on each song 😅)
#RStats#tidyverse#ggplot2#music#dataviz
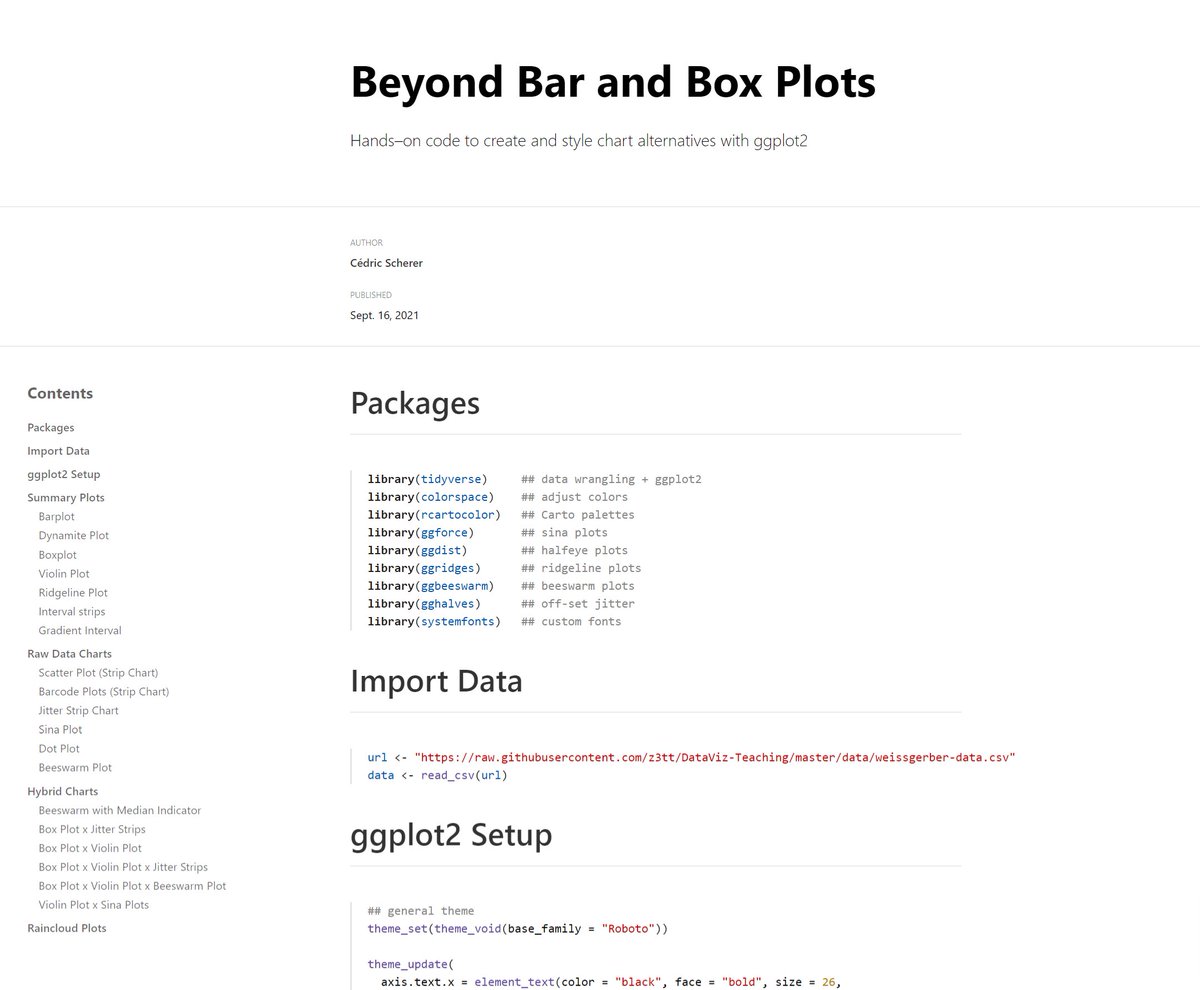
👨💼All materials for yesterday's session at @USGS_CDI on bar and box plot alternatives and how to design them in #rstats with #ggplot2.
🔗 https://t.co/jwOgTEDnTk
➡️ slides of my talk
➡️ notebook and source code to rebuild all the charts
⏳ recording (will be added later)
We are happy to announce that this week, https://t.co/PCKCzkYvrv will be talking about officeverse: Creating Word and PowerPoint documents with R.
Curious? Join us at 7pm UTC (8pm CET) at https://t.co/Sqfnn4jLVe
We will wait for you there, #rstats!
Sponsored by @jumping_uk
We are delighted to come together with you to host another online meetup. We will have the pleasure to be hosting Julia Silge @juliasilge
To RSVP👉 https://t.co/Xiuu4Hwlmt
For more details 👉https://t.co/QERJSYj7US
#rstats#rladies#dataviz#MachineLearning
Happy to announce version 1.2.0 got on CRAN 🎉🎉
- Added 5 packages (khroma, beyonce, suffrager, colorBlindness, and rtist) bringing the total to 56
- 187 more palettes bringing the total to over 2000 🤯 with 2051!
- Is now easier to install with regards to dependencies
#rstats
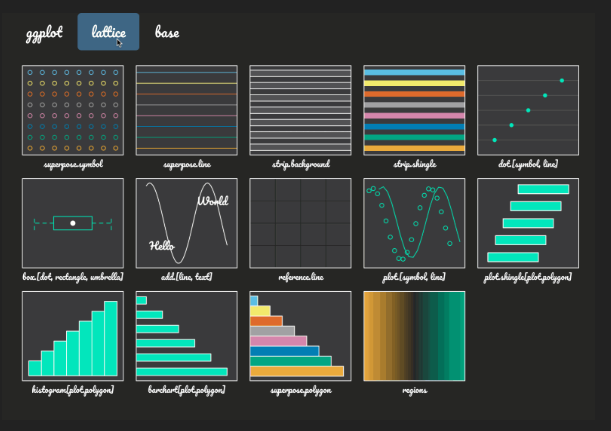
Super excited to announce the new thematic #rstats Package for unified and auto theming of ggplot2, base, and lattice graphics. Use it to automatically theme R plots in shiny, rmarkdown, and #Rstudio
Give it a spin:
https://t.co/W9A9HjeOxa
#MachineLearning#DataScientist


![data_question's tweet photo. Assume you are using `data.table` package for the following operation. How many columns will `D1` have after executing following code? [see_image_1] #RStats #DataScience [TimeStamp:17092021123049] https://t.co/k02qaiQMWt](https://pbs.twimg.com/media/E_fL-bYWQAQyBmh.png)