Harvard-trained MD-PhD Cardiologist-Lipidologist with two decades experience in clinical trials who runs a large preventative cardiology and lipid practice.
The little dog on the right refused the treat he was offered—not because he didn't want to eat it, but because he wanted his blind friend to be fed first.
He waited patiently until his companion had finished, and only then did he accept his own little piece.
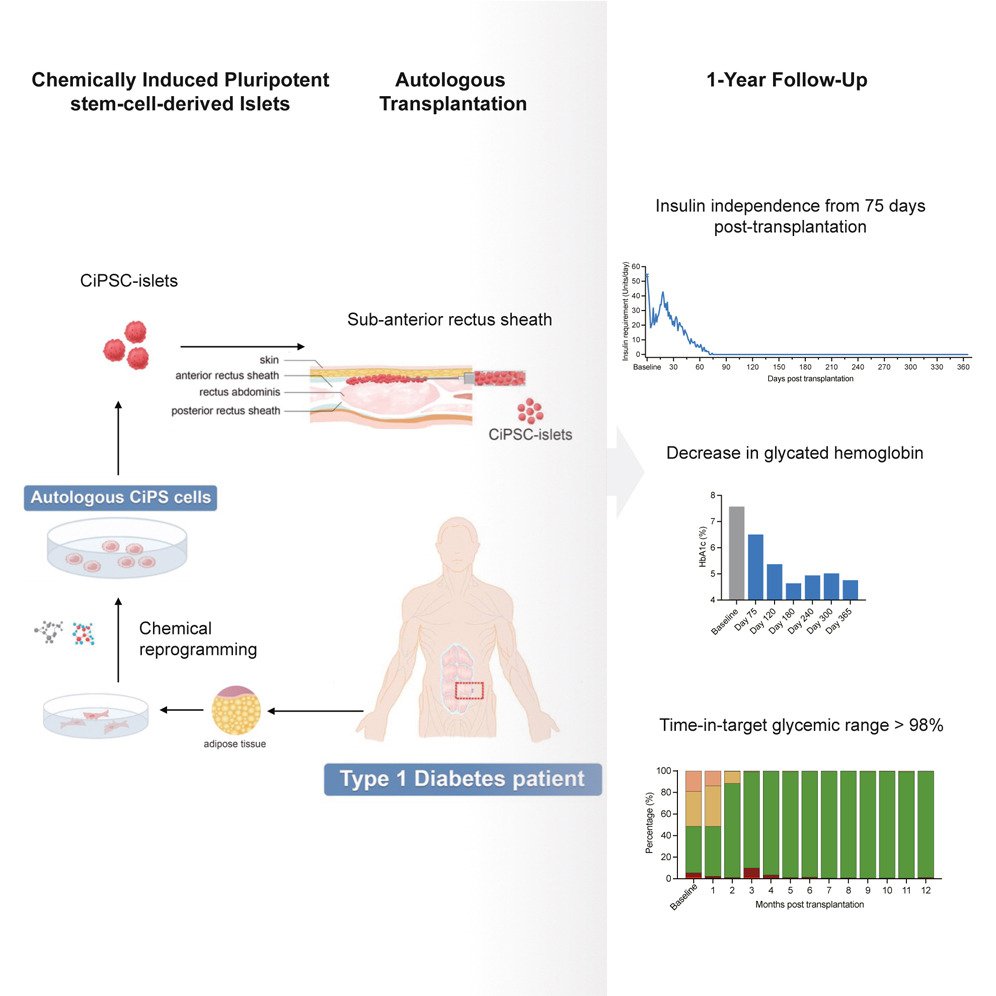
A woman with type 1 diabetes stopped needing insulin 75 days after a transplant, and a year later, she still does not.
Type 1 diabetes happens because the immune system destroys the islet cells in the pancreas that make insulin. Transplanting islets from a dead donor has worked since 2000, but donors are scarce and the recipient has to take immunosuppressants for life.
The obvious fix is to grow islets from the patient's own cells. The obvious problem is that the standard method uses Yamanaka factors, delivered by a virus, including one that is a cancer gene.
This team skipped all of that. They reprogrammed her own cells back into stem cells with small molecules alone, with no virus and no Yamanaka factors, and then turned them into islets.
The surgeon placed them under the sheath of muscle in her abdomen instead of in the liver, where islets usually go, because a graft you can see on a scan is a graft you can cut out if it misbehaves.
Her time in the healthy glucose range went from 43% to over 98%.
One patient, published in @CellCellPress. She was already on immunosuppressants for a previous liver transplant, so this does not yet tell us whether autologous islets can escape the autoimmune attack that caused the disease in the first place.
This is an impressive proof of concept, but the real test is whether it works in patients who are not already immunosuppressed.
Very interesting analysis by Justine Cole and Allan Sniderman team pointing out flaws of the 2026 AHA Dyslipidemia Guidelines: specifically as to how they positioned apoB vs calculated LDL-C. The discordance between apoB/various calculated LDL-Cs supersedes the guideline estimations. Authors make the case that their evidenced-based approach (read the article) would have been to position apoB at top and not give apoB a secondary consideration. Graphics which speak for themselves (enhancement is mine). Open access at https://t.co/2zihIaL97T @LipidJournal@nationallipid@foundationofnla@society_eas@ASPCardio@escardio@atherosociety@TheEndoSociety #cholesterol @RZubiranS
Fifty-five observational studies including over 7 million patients were analyzed. Statin use significantly reduced the risk of dementia compared to nonusers (hazard ratio [HR] 0.86; 95% confidence interval [CI]: 0.82 to 0.91; p<0.001). It was also associated with reduced risks of AD
Rosuvastatin demonstrated the most pronounced protective effect for all cause dementia among specific statins (HR 0.72; 95% CI: 0.60 to 0.88). The findings underscore the neuroprotective potential of statins in dementia prevention. Despite the inherent limitations of observational studies, the large dataset and detailed sub group analyses enhance the reliability of our results. @nationallipid@foundationofnla@society_eas@ASPCardio@FamilyHeartFdn@fhpatienteurope #statins
Cholesterol Homeostasis in the Hepatocyte
👉An extraordinary and truly challenging paper on cholesterol homeostasis
1⃣ The hepatocyte is not a fibroblast. The classic SREBP2–LDLR model may not adequately explain hepatic cholesterol homeostasis.
2⃣ Not all cholesterol entering the hepatocyte behaves the same. Its intracellular fate may depend on whether it arrives through LDL, chylomicron remnants, or HDL.
3⃣ The apoB100 pathway may function largely as a closed cholesterol loop: liver → VLDL → IDL → LDL → liver.
4⃣ Provocative concept: LDL may have no significant physiological role in net cholesterol delivery to peripheral tissues—challenging the traditional “LDL delivers cholesterol to cells” paradigm.
5⃣ The proposed “channel model” is not yet proven, but it raises a fundamental question: could LDL be better understood as a metabolic end-product of VLDL metabolism rather than a physiologically required cholesterol-delivery system?
👆A thought-provoking paper that forces us to reconsider some of the most deeply rooted concepts in lipoprotein physiology.
Congrats @RZubiranS and co-authors
🔗🔓https://t.co/TDsSmzR7oO
@society_eas@LipidJournal
La fondue savoyarde. Le plat emblème de la cuisine conviviale.
La première trace remonte à 1699, dans un manuscrit zurichois d’Albert Hauser. La recette s’appelle « Pour cuire le fromage avec du vin ». La Suisse tient déjà son idée.
Le plat reste confidentiel jusqu’aux années 1930. L’Union suisse du commerce de fromage en fait alors un emblème national pour relancer les ventes. En 1940, à l’Exposition universelle de New York, elle est présentée comme plat national suisse.
En Savoie, l’historienne Marie-Thérèse Hermann est formelle : avant-guerre, on n’y fait pas de fondue. Plat de luxe connu grâce aux Genevois, elle s’installe dans les Alpes françaises après-guerre, avec l’essor des sports d’hiver dans les années 1950.
La version savoyarde s’écarte de l’originale. Là où la recette fribourgeoise marie gruyère et vacherin, la Savoie utilise beaufort, abondance, emmental ou gruyère de Savoie. Le pain doit être rassis, la croûte obligatoire sur chaque morceau sous peine d'accident au fond de la caquelon.
Une règle voyage avec le plat. En Suisse, celui qui perd son pain dans le caquelon offre une bouteille. En France, il écope d’un gage.
Aujourd’hui, elle a gagné sa place. Un sondage Ipsos de 2026 la classe parmi les plats qui incarnent le mieux la gastronomie française, aux côtés du bœuf bourguignon, du cassoulet et des escargots de Bourgogne.
Plat d’estivage devenu symbole d’hiver, il prouve qu’une frontière politique résiste peu à deux régions qui partagent les mêmes alpages.
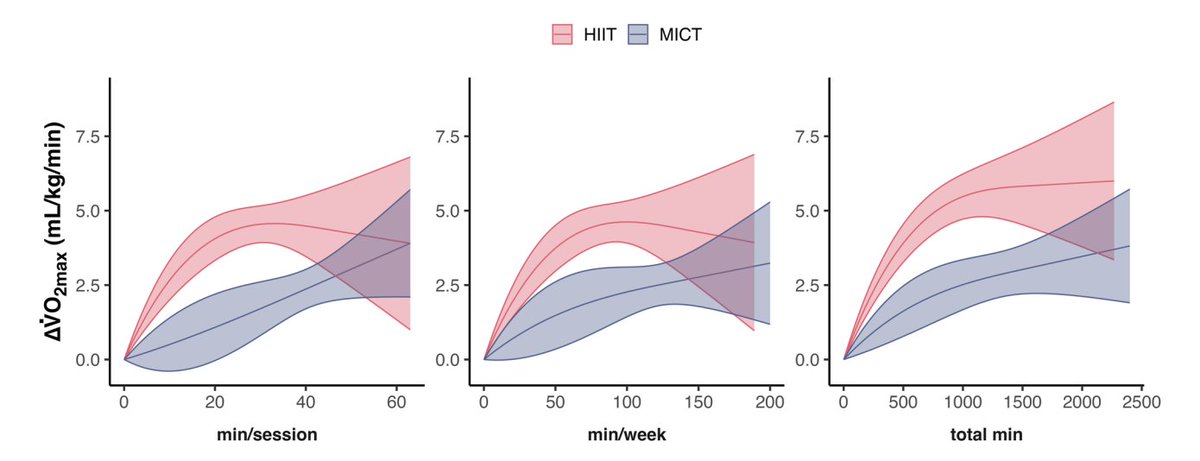
Most people assume more exercise equals more fitness. A dose-response analysis of 69 trials found high-intensity training hits 80% of maximal effect in 11 minutes, while moderate training requires 52 minutes for the same result.
Researchers at the University of Tübingen and Liverpool John Moores University conducted a meta-analysis examining 2,387 participants across 69 randomized controlled trials. The goal was to map the exact relationship between exercise duration and fitness improvements for two different training approaches.
The analysis compared high-intensity interval training, or HIIT, against moderate-intensity continuous training, known as MICT. HIIT involves brief bursts of hard exercise interspersed with recovery periods. MICT is the traditional steady-state cardio most people perform at the gym.
The primary outcome was VO2max, the maximum amount of oxygen your body can use during exercise. VO2max is the gold standard measure of cardiorespiratory fitness and predicts cardiovascular disease risk and all-cause mortality.
Within each training type, session durations varied considerably. HIIT sessions averaged 25 minutes, ranging from very brief protocols under 10 minutes to longer sessions exceeding 40 minutes. MICT sessions averaged 43 minutes, with similar variation.
This variation allowed researchers to model dose-response curves. A dose-response curve shows how much benefit you get from increasing amounts of something. In this case, the dose is exercise duration per session, and the response is the improvement in VO2max.
HIIT and MICT produced fundamentally different dose-response patterns.
HIIT followed a non-linear curve. Fitness gains increased rapidly with the first few minutes of exercise per session, then plateaued. The curve flattened around 23 minutes per session, meaning additional time beyond that point provided minimal extra benefit.
MICT followed a linear pattern within the observed range. Fitness continued improving proportionally with each additional minute of exercise. The curve showed no plateau, suggesting benefits might continue accumulating at even longer durations.
The key finding centers on effective dose calculations.
Researchers calculated ED50, ED80, and ED100 values. These represent the exercise dose required to achieve 50%, 80%, and 100% of the maximal predicted effect for each training type.
For HIIT, 80% of maximal VO2max improvement occurred with just 11.4 minutes per session. The maximal effect required 23.2 minutes per session. For MICT, reaching 80% of maximal effect required 52.4 minutes per session, and maximal effect occurred at 63 minutes.
That represents a 4.6-fold difference in time requirement between HIIT and MICT to achieve similar cardiorespiratory adaptations.
The actual fitness improvements also favored HIIT. High-intensity training increased VO2max by 4.36 mL/kg/min on average, compared with 2.59 mL/kg/min for moderate training. Between-group comparison showed HIIT superior by 1.20 mL/kg/min.
Key findings:
• HIIT achieved 80% of maximal fitness gains in 11 minutes per session
• MICT required 52 minutes per session for equivalent improvements
• HIIT showed non-linear dose response with plateau at 23 minutes
• MICT showed linear dose response with no observed plateau
• Time efficiency advantage persisted across age, baseline fitness, and health status
When researchers isolated only the high-intensity work time, excluding recovery periods, the dose dropped further. Eighty percent of maximal VO2max gains occurred with just 5 minutes of actual hard work per session.
This matters because HIIT sessions include substantial recovery time. Across included studies, recovery comprised 50% of each session on average, with work-to-rest ratios ranging from 1:9 to 5:1.
The dose-response pattern held regardless of participant characteristics. Researchers tested whether the curve shape differed between healthy individuals and those with cardiometabolic risk factors like obesity, pre-diabetes, or pre-hypertension. No statistical difference emerged.
Baseline fitness level and age also failed to moderate the effect. The relationship between exercise duration and fitness gains remained consistent whether participants started with low or moderate fitness, and across the age spectrum examined.
Despite the dramatic differences in VO2max improvements, HIIT and MICT produced comparable effects on cardiometabolic risk factors. Both reduced body fat, blood pressure, triglycerides, and fasting insulin to similar degrees.
This dissociation suggests different mechanisms drive central versus peripheral adaptations.
VO2max is centrally limited by cardiac output, the amount of blood your heart pumps per minute. High-intensity exercise creates elevated cardiac preload and peak output that appears particularly effective for cardiac adaptation.
Metabolic improvements depend more on peripheral factors like total caloric expenditure and glycogen depletion. These can accumulate through either high intensity or long duration, explaining why both approaches produce similar metabolic benefits.
The non-linear HIIT response reveals a physiological ceiling. Once you've provided sufficient stimulus to trigger maximal cardiac adaptation, additional high-intensity volume adds little. The steep early curve shows most adaptation occurs from minimal doses.
The linear MICT response suggests volume-dependent adaptation. Moderate intensity may require accumulation of training stress over longer durations to produce equivalent central adaptations, but shows no apparent ceiling within typical session lengths.
Practical implications require nuance.
These are population-level averages derived from protocols with substantial variation in intensity prescription, work-to-rest ratios, and recovery structure. Individual responses vary.
The 11-minute HIIT estimate includes recovery periods. The actual high-intensity work averages around 5 minutes per session for 80% of maximal effect. But recovery structure matters for tolerability and adherence.
MICT prescriptions in these studies ranged from 50-80% of VO2max or 65-80% of maximum heart rate. Some participants likely exercised above their first metabolic threshold, technically in the heavy rather than moderate domain, which may affect the apparent dose-response.
The findings don't suggest HIIT should replace all other training. Both modalities produced equivalent cardiometabolic improvements despite different time requirements for VO2max. A flexible approach combining both based on time availability and preference may prove more sustainable.
When time is limited, the steep early HIIT curve offers efficient stimulus. Most cardiorespiratory gains come from just a few minutes of hard work. When time allows, accumulating moderate-intensity volume provides comparable adaptation through a different route.
The dose-response framework also identifies a point of diminishing returns. Extending HIIT sessions beyond 20-25 minutes per session provides minimal additional VO2max benefit. Training programs can optimize time investment by recognizing where each additional minute stops mattering.
The decisions about exercise prescription now have quantitative backing. The relationship between time investment and fitness outcome follows predictable curves that differ by intensity. Understanding these curves allows more informed choices about how to structure training for specific goals.
Following a recommendation from the DMD Boehringer Ingelheim has decided to discontinue the EASi-KIDNEY trial (NCT06531824)
Testing vicadrostat (BI 690517), in combination with empagliflozin vs empagliflozin alone, could slow CKD and ⬇️ CV events
https://t.co/1w7DJyqx6C
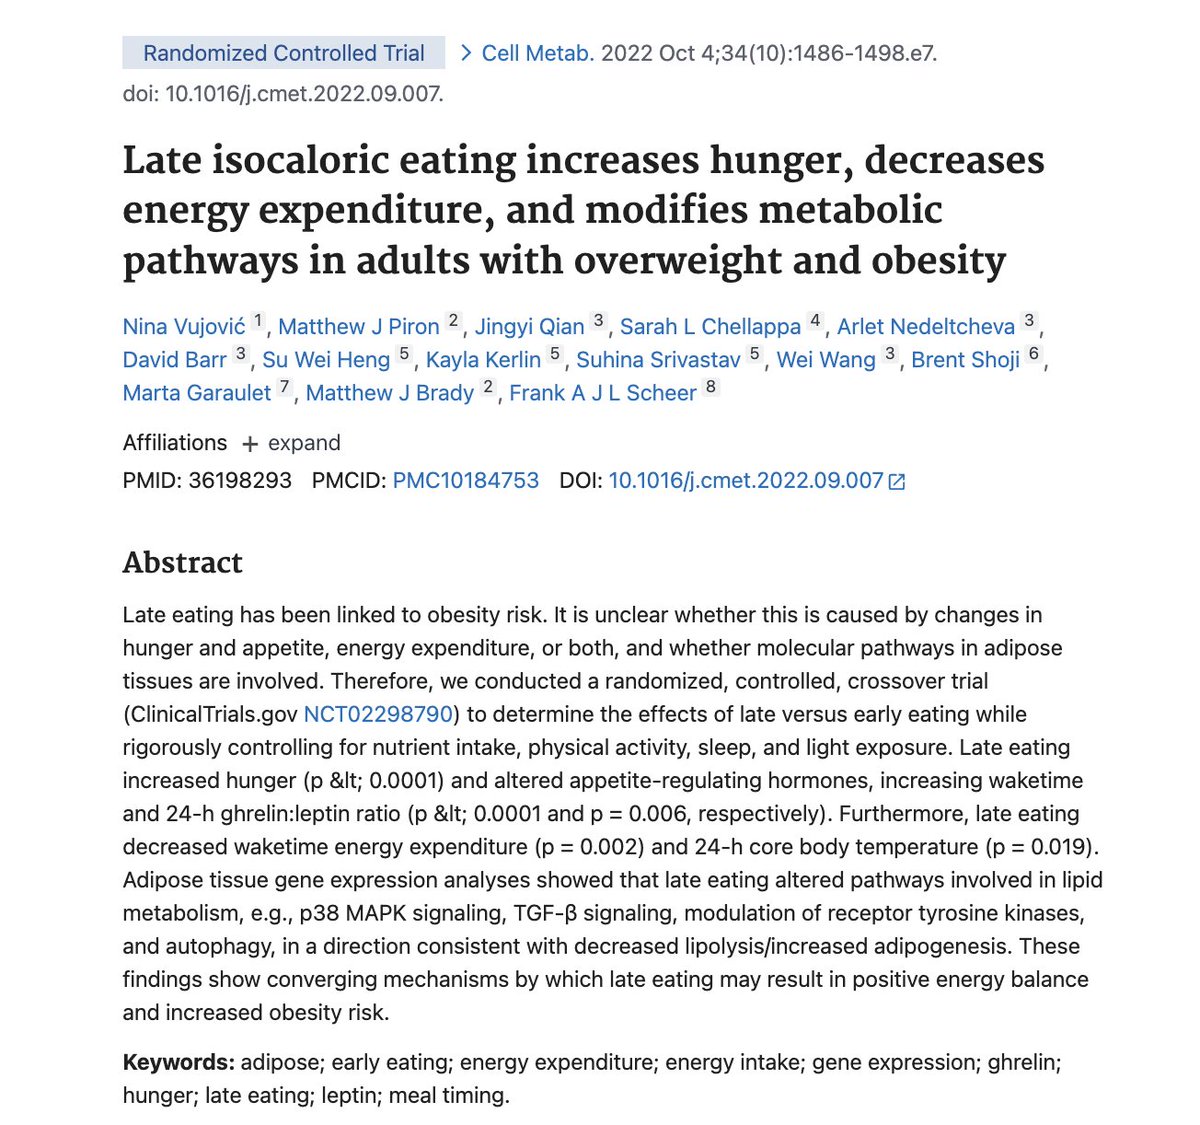
Eating late at night makes you hungrier the next day, burns fewer calories, and changes gene expression in fat tissue to favour storage over burning. A 2022 study in Cell Metabolism tested all three in a controlled experiment and found that eating four hours later, same food, same amount, produced a measurably worse metabolic outcome.
The study was led by Frank Scheer at Harvard Medical School. He took 16 overweight adults and put them through two conditions: early eating, where the last meal was at about 6 p.m., and late eating, where the same meals were shifted four hours later. The calories, the macros, and the activity level were identical. The only difference was the clock.
In the late-eating condition, levels of the hunger hormone leptin were lower across the full 24-hour cycle, meaning the body was sending weaker "stop eating" signals. Participants burned about 60 fewer calories per day. And when the researchers biopsied fat tissue, they found that gene expression had shifted toward storing fat and away from breaking it down. The same food, eaten later, told the fat cells to hold on to more.
The 60-calorie difference sounds small. Over a year it adds up to about six pounds. The hunger difference sounds small too, until you consider that leptin is the hormone that determines whether you reach for a snack at 10 p.m. A late dinner lowers the hormone that would have stopped the late snack, which is the meal after the late dinner.
The body runs on a clock. The clock says dinner at 6 is not the same meal as dinner at 10, even if the plate is identical. https://t.co/C3YPndfK6Z
Les chênes qu'on abat aujourd'hui dans cette forêt ont été mis en réserve sous Louis XIV. Ceux qui les remplacent seront coupés vers 2300.
C'est la seule forêt de France métropolitaine exploitée sur un cycle de plus de deux cents ans.
Elle s'appelle Tronçais, elle est dans l'Allier, et elle couvre 10 600 hectares.
Tout part d'une décision de 1670. Colbert fait délimiter et réaménager la forêt, et il la réserve à la marine du roi.
Le calcul est simple et démesuré. Un chêne bon pour un vaisseau met deux siècles et demi à se faire. Les arbres qu'on met de côté ce jour-là seront coupés par des hommes dont les arrière-arrière-grands-parents ne sont pas encore nés.
Pour obtenir ce bois, on fait pousser les chênes serrés les uns contre les autres. Privés de lumière sur les côtés, ils montent droit et perdent leurs branches basses tout seuls. Le tronc grandit sans nœuds.
Le plus haut de la forêt mesure 47,50 mètres.
La marine, elle, n'en a presque rien tiré.
Le temps que les arbres soient mûrs, les coques se construisaient en fer. Et les charpentiers de marine avaient surtout besoin de pièces courbes, pour épouser la forme des bateaux. Tronçais ne produisait que des troncs droits.
Ce qui était un défaut pour la marine est devenu une valeur ailleurs. Un bois droit, sans nœud, à grain serré, se fend en lattes régulières. Et des lattes régulières, cela fait des douves de tonneaux.
Les grands vins de Bordeaux et le cognac vieillissent dans du chêne de Tronçais.
Le bois des fûts qu'on remplit cette année vient d'arbres qui poussaient déjà avant la Révolution.
Fun fact.
The Monarch butterfly migration is one of the longest-known, multi-generational insect migrations on our planet. Every fourth generation lives 8 times longer than the previous generations and travels 10 times farther.
Few birds reveal the physical power of a predator as clearly as a female harpy eagle.
Its legs can be thicker than a human wrist and its talons can exceed 10 centimeters.
Glucose and fructose are both six-carbon sugars with identical chemical formulas. But a recent Nature Metabolism review proposes they trigger completely different metabolic responses in your body. The distinction may explain why sugar drives disease in ways that other calories don't.
Researchers synthesized decades of biochemical data into what they call the fructose survival hypothesis. The core idea: fructose evolved as a metabolic signal of plenty, instructing your body to store energy aggressively. Under modern conditions of chronic excess, that same signal drives metabolic dysfunction.
The key difference starts with how each sugar enters metabolism.
When you eat glucose, it faces regulatory checkpoints. The enzyme phosphofructokinase controls glucose breakdown and responds to your cell's energy status. When ATP is high, the enzyme slows down. When ATP is low, it speeds up. This creates a feedback loop that matches glucose processing to energy demand.
Fructose bypasses this entire system.
It gets processed by an enzyme called ketohexokinase that lacks regulatory control. Fructose enters your liver and gets phosphorylated regardless of your cell's current energy state. This unregulated entry has immediate consequences that researchers have measured directly.
Studies using phosphorus MRI show that fructose consumption temporarily depletes liver ATP, your cell's energy currency. One mechanism involves rapid phosphorylation that consumes ATP faster than mitochondria can regenerate it. Another involves the breakdown of adenine nucleotides into uric acid, which then gets excreted rather than recycled.
You're converting ATP into uric acid and losing the building blocks needed to make more ATP.
This temporary energy deficit appears to trigger a metabolic program focused on fat synthesis.
When fructose breakdown generates intermediate molecules, they flow directly toward fat production rather than getting burned for energy. The process involves several pathways:
• Fructose carbons convert to acetyl-CoA and malonyl-CoA, the building blocks of fatty acids
• It activates ChREBP, a transcription factor that turns on genes for fat synthesis
• Uric acid produced during fructose metabolism further activates fructokinase, creating a feed-forward loop
• It reduces fat oxidation in mitochondria through post-translational modifications of metabolic enzymes
Human studies show measurable differences. Ten weeks of fructose-sweetened beverages increased visceral fat, liver fat, and blood triglycerides compared to glucose-sweetened drinks with identical calories. The fructose group also showed reduced insulin sensitivity.
The hypothesis extends beyond direct metabolism. Fructose appears to increase intestinal permeability, allowing bacterial endotoxins into circulation. These endotoxins activate inflammation, which the authors propose amplifies fructose-driven fat synthesis. The gut microbiome also converts fructose-derived metabolites into acetate, which the liver then uses to build more fat.
Recent data link fructose to cancer growth, though through an indirect mechanism. Dietary fructose increased lipid transfer from the liver to tumors in mice, providing cancer cells with building blocks for membrane synthesis. Separately, other studies found fructose metabolism active in colorectal tumors.
The review proposes fructose may also contribute to cognitive decline. Your brain can produce fructose from glucose through a pathway called the polyol pathway. When this pathway activates excessively, it may generate fructose in brain regions involved in memory and learning, potentially contributing to neurodegeneration.
Some important caveats frame this as theory rather than settled science:
• Much of the mechanistic data comes from animal models or cell culture, not long-term human studies
• Human intervention trials typically use high doses of isolated fructose, not the mixed glucose-fructose found in table sugar
• The cancer and dementia links remain correlational with mechanisms that need validation
• Individual variation in fructose metabolism appears substantial but isn't well characterized
• The dose-response relationship in humans under normal dietary conditions remains unclear
The framework does explain several observations that calorie models struggle with. Why do fructose and glucose produce different metabolic outcomes at identical caloric intake? Why does sugar consumption correlate with metabolic disease independent of body weight? Why do populations with high sugar intake show elevated disease risk even after controlling for total calories?
The proposed answer: fructose isn't just a calorie source. It's a metabolic signal that evolved to promote aggressive energy storage during periods of food abundance. That signal made sense when fruit availability was seasonal and famine was common. It becomes pathological when activated chronally through year-round sugar consumption.
Whether this hypothesis fully explains sugar's role in chronic disease requires more direct human evidence. But the biochemical mechanisms show clear differences in how your body processes fructose compared to other nutrients.
The choices you make about sugar intake, particularly from sweetened beverages and processed foods high in added sugars, may determine whether you activate metabolic pathways designed for survival conditions that no longer exist.
“To be happy you must eliminate two things: the fear of a bad future and the memory of a bad past.”
- Seneca
Seneca (4–65 AD) was a Roman Stoic philosopher, statesman, and author whose teachings emphasized self-control, inner tranquility, and the importance of living wisely despite the uncertainty of life. He believed that much of our suffering is caused not by events themselves, but by the way we think about what has happened or worry about what could happen.
“To be happy you must eliminate two things: the fear of a bad future and the memory of a bad past.”
This idea reflects an important Stoic principle: we often lose the present by focusing on two things beyond our control—the past and the future. What has already happened cannot be undone, and what lies ahead has not happened yet. Still, regret about yesterday and anxiety about tomorrow can prevent us from appreciating the peace available to us in the present.
Seneca’s message is not that we should erase the past or stop thinking about the future. Rather, we should take lessons from our past without allowing it to control us and prepare for what lies ahead without being consumed by fear. Inner peace comes from bringing our attention back to the one moment we can truly experience and influence—the present.
🔥 Hot off the press: We identified how and where AF begins.
I am excited to share this work.
Since the discovery of PV triggers more than 25 years ago, AF ablation has evolved into an empiric therapy centered on PVI. Yet, we have never been able to identify the arrhythmogenic substrate that determines why a premature beat initiates AF at one site and not another.
We believe this study changes that.
In this mechanistic study, we found that AF initiation arose predominantly through reentry originating from a small number of spatially discrete regions with steep repolarization gradients. Their distribution was unique to each patient, and they accounted for more than 92% of AF initiation episodes.
Importantly, the arrhythmogenic substrate was not defined by low voltage, and while conduction abnormalities were often present, they appeared to play a secondary role.
Its patient-specific distribution may help explain the controversy surrounding posterior wall isolation: the posterior wall harbored the substrate in only approximately 30% of patients. Importantly, in redo patients with durable PVI, right-atrial substrate (which is often beyond standard mapping strategies) was identified in 30%.
Most encouragingly, in an exploratory cohort of 24 patients with recurrent AF and durable PVI (50% PerAF), targeted elimination of these sites achieved 87.5% single-procedure freedom from any atrial tachyarrhythmia over a median of 489 days, without antiarrhythmic drugs.
The thoughtful accompanying editorial by Jon Kalman highlights the significance of this discovery and its central translational challenge of bringing it into real-world clinical practice.
But stay tuned! Technology is under development to transform this discovery into a rapid, automated functional mapping.
Current electroanatomic mapping relies largely on voltage amplitude and activation timing. We need to move beyond these measures and map how tissue actually functions - how it conducts, repolarizes, and responds to premature stimulation. This can add the critical dimension that has long been missing from substrate mapping and may reveal what truly makes cardiac tissue arrhythmogenic.
To me, this is the beauty of physiology: there are no black boxes. We can identify the sites that reproducibly initiate the arrhythmia, define their EP properties, eliminate them with ablation, and confirm that arrhythmia can no longer be initiated.
The next steps are prospective multicenter validation and technological development. Together, they may move AF ablation beyond empiric therapy toward truly individualized, mechanism-guided therapy.
📄 Paper in @JACCJournals:
https://t.co/izIR8HbNYk
📝 Editorial:
https://t.co/mYIilXkjJ7
#JACCCEP #AtrialFibrillation #CardiacElectrophysiology #CatheterAblation #EPeeps
Milton Packer's HFpEF thesis in @JACCJournals (104 pages long): preserved-EF HF is driven primarily by excess & dysfunctional adipose tissue and its adipokines
Hypertension, diabetes & metabolic syndrome largely downstream, not independent causes
https://t.co/1fw1idpolY