This is how I think about strategies at a volatility hedge fund.
I like to consider ourselves a blend of quantitative and discretionary trading. The primary reason is that trading from the long-volatility side of the market constantly reminds you of a fundamental problem: the events that matter most are often the events for which you have the least amount of data.
Outlier events, structural breaks, changes in market microstructure, and shifts in participant behavior do not always provide enough historical observations to build a purely quantitative system with complete confidence. At the same time, relying entirely on human intuition creates its own set of problems: bias, inconsistency, emotion, and the tendency to see patterns that may not actually exist.
This hybrid approach makes the two disciplines serve as safeguards for one another.
Here is an example of how that infrastructure works:
1) Idea generation begins at screen observation.
One of the traders notices something interesting in the market: a recurring behavior, an unusual relationship, etc.
Rather than immediately searching through data for something profitable, the observation comes first and is then passed to the quantitative side of the business. I think this distinction is extremely important. It creates a natural safeguard against data mining and overfitting. We are generally starting with a market hypothesis and asking the data whether it is real, rather than starting with the data and searching endlessly until we find something that looks profitable.
2) The quantitative arm attempts to validate or kill the idea.
Once the idea reaches the quant side, statistical validation begins.
Can we isolate this specific source of alpha? Does it persist across different periods and regimes? Is the relationship statistically meaningful? The objective at this stage is not to prove the trader right. It is to independently validate or negate the hypothesis.
3) If the edge survives, we begin designing the strategy.
Assuming the edge holds up, the discussion moves back and forth between the trading and quantitative teams. This is where instrument selection, tenor, strike, sizing, liquidity, and implementation all begin to matter.
An edge can be completely real and still be capitalized on poorly. Identifying the underlying phenomenon is only half the battle. But at this stage, we have our first real version of a “strategy.”
4) Then the real testing begins.
We strip out an OOS and begin testing the strategy historically.
We incorporate practical assumptions around transaction costs, market impact, capacity (NBBO tests). We want to know whether the edge remains economically meaningful after accounting for the realities of actually trading it.
The standard should be whether that evidence remains convincing after you have done everything reasonable to try to break it.
5) Once validated, the strategy is formally documented. Before anything goes into production, a formal write-up is completed and signed off on by every member of the team.
The document defines exactly what we believe the edge is, why we believe it exists, the statistical evidence supporting it, how we intend to monetize it, and the risks surrounding the implementation.
Just as importantly, we explicitly define failure conditions and escape valves. What would cause us to reduce risk? What would cause us to stop trading the strategy entirely? Conversely, what milestones would justify increasing capital?
I think this is an underrated part of systematic trading. You want to define what failure/ success looks like before you are emotionally or financially invested in the outcome.
6) The strategy enters production slowly.
Once approved, the strategy is introduced with a relatively small amount of capital. We monitor realized transaction costs, fills, liquidity, market impact, signal decay, and whether the live return distribution resembles what we expected.
(Continued below)
One of the relatively obscure stats I track is a 21-day SMA of the % difference between the daily high and the daily low in the $SPX. The current value is 0.57%, which happens to be the lowest reading since before the pandemic
$VIX
it's off to college shopping...the parents are buying bed spreads...I say buy some put spreads instead
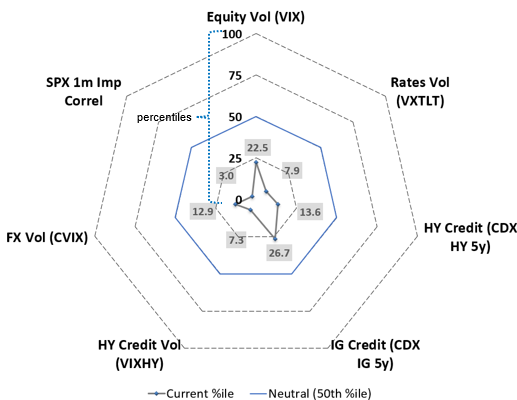
I love this risk radar as a visualize tool. When everything is close to the center, you know these vols are LOWWWW (5 year percentiles).
Oftentimes in trading, there are tendencies that emerge from larger agents in the space. At a certain point, these agents leave footprints around some of the specific edges they focus on through their timing and execution tendencies.
For extended periods of time, these footprints can end up driving the price of certain assets over shorter time frames. Most of the time it’s hard to deduct why or where the edge is derived from.
A great example of this was the event vol trade back in 2022. Almost every Fed meeting would be met with a heavy offer in the /VX market from a larger agent, ultimately driving vol lower during the meeting. After a while, the market caught onto the footprint, and that specific trade began to go away.
These footprints sometimes stem from tactical end users of risk, such as active trading desks, and other times from mandate-driven flows, such as larger institutions building up a specific profile to achieve a target return.
They appear and evaporate at times for no rhyme or reason. But at the end of the day, that is part of the alpha cycle. Oftentimes, it is hard to explain, but much easier to prove that it is there.
$VIX Fun Fact 🧠
The single largest one-day $VIX spike in history happened on Feb 5, 2018 (Volmageddon):
17.3 ➔ 37.3 (+116% in a single session).
For context, 2nd place is Dec 18, 2024 at +74%.
True tail risk happens fast. ⚡
One year ago on July 9th, $UVXY made a fresh ATL after recovering from a 100%+ "Liberation Day" spike.
One year later:
UVXY has dropped 72% (or 2.4% per week)
$VXX has dropped 53% (or 1.4% per week)
$UVIX has dropped 85% (or 3.5% per week)
These are in line with historical averages.
The risk/reward curve cannot be cheated so VXX is less "risky" than UVIX and you are paid accordingly. The market knows all of this so as derivatives they are priced respectively.
Options only price in a little over half of this move as there are always unknowns, and both conservative and aggressive pricing can be gamed.
As a quant, I share how I take advantage of and exploit this structure:
https://t.co/pljMyEbii4
If you run a multi-expiry options book and you're looking at one total Vega number, that number is probably lying to you.
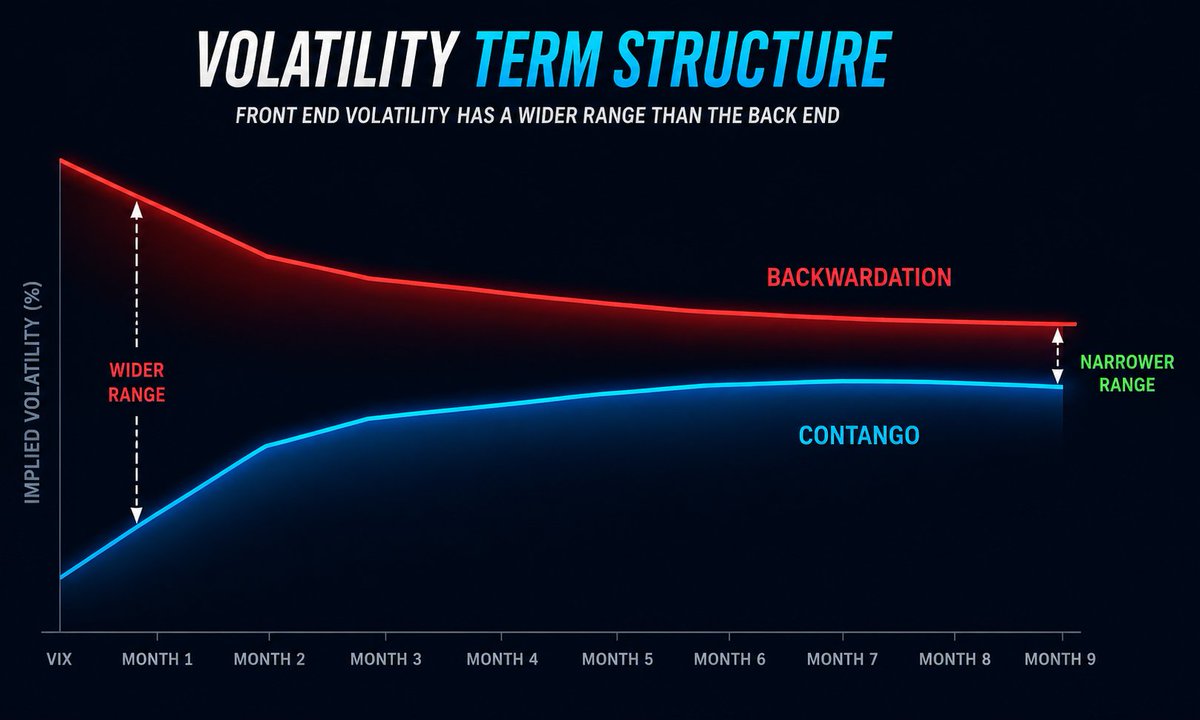
Here's why. A one-month implied vol can swing around in a huge range. A one-year implied barely moves by comparison. So a dollar of Vega in the front and a dollar of Vega in the back are not the same risk at all. They don't move together.
Add them up raw and you get a number that feels precise and means very little. You might think you're roughly flat vol when you're actually very long the front and short the back, or the other way round.
What desks do instead is weight each expiry before adding, more weight to the reactive short end, less to the sleepy long end. That gives you one honest number for whether you're really long or short implied vol. For me, until you weight it, you don't actually know your vol exposure, you just think you do.
The weighting is usually 1/sqrt(T) as a base case assumption. So 3-month vol moves double 1-year vol.
The odds of a big $VIX spike within the next 20 days just rose above 10% on our VRP radar.
#VIX#VRP
Scanned via TradeIntel tools.
https://t.co/6qJgQRhNH5
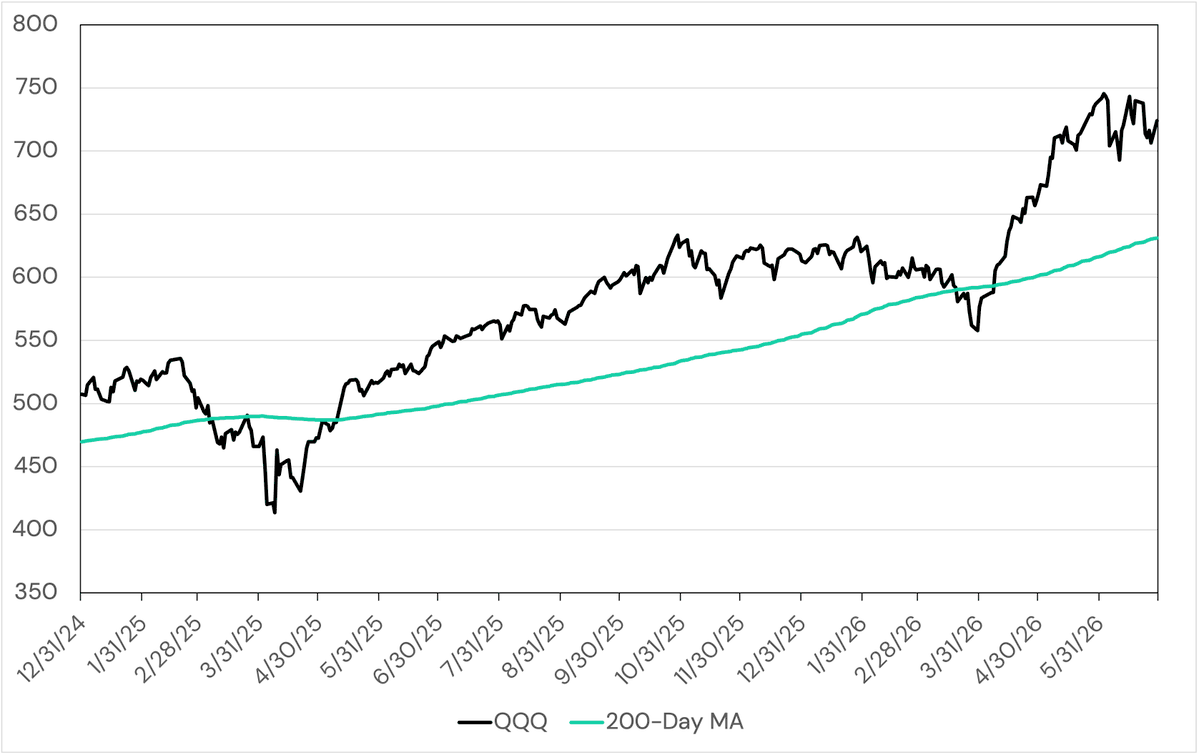
I know it's kind of stupid, but when something is 20% above its 200-day moving average, you'd need to see ~61% annualized return to maintain that distance.
g ≈ 2Y / (N-1)
(g is the daily growth rate; Y is the distance above moving average; N is the length of the moving average.)
As we leave the historically weakest week of the year behind us today, we now enter the 12-Day Midyear Rally: the last three trading days of June and the first nine trading days of July.
Since 1985, the Nasdaq has returned an average of +2.5% during this period and has finished higher 78% of the time.
This is now
▪ The 10th time in 20 years
▪ VIX has gone from
▪ The 22s to the 15s
▪ Within 2 trading days
All 9 prior events (100%)
▪ SPX was higher exactly 1 month later
▪ With a median return of +2.8%
The only thing I’ll say is that when Vols are so unreactive, it’s a good sign that the dealer community has identified the source of where that flow is coming from and the market can well absorb it.
When the reverse is in play, it’s a scary thing that warrants much more attention.