Market leverage in Asian markets is through the roof:
Assets under management (AUM) in leveraged South Korean and Taiwanese ETFs are up to a record $65 billion.
Since the start of 2026, total leveraged ETF AUM has surged +490%.
This comes as 16 new single-stock leveraged ETFs tied to Samsung and SK Hynix were launched in South Korea two weeks ago.
By comparison, AUM in US leveraged ETFs stands near a record ~$180 billion.
Meanwhile, the SK Hynix 2x long Leveraged ETF surged +50% on Monday despite a -7.7% decline in SK Hynix shares, posting a rare divergence.
This fund should have declined -15% under normal tracking conditions.
Other single-stock leveraged ETFs tracking SK Hynix ended the session within normal ranges.
Investors are taking on more leverage than at any point in history.
NDR's pattern matching tool shows that the NASDAQ has closely tracked the dotcom analog and is closer to 1998 than 2000. It still suggests near-term volatility ahead.
Nasdaq just triggered 8 Hindenburg Omen and Titanic Syndrome warnings in 3 weeks.
When the 3-week warning count reached 8+, Nasdaq annualized returns averaged -24%.
Price keeps pushing higher. So do the warnings.
Read full analysis:https://t.co/iJUI9CJyKS
Great data. Seasonals like this are real, and at the same time, beneath the surface, Autos, Transports, Homebuilders, and Financials are all diverging from $SPX near its 252-day high.
In 10 prior setups, the 3-month median return was -2.9% with a 44% win rate. The 1-year median comes back to +13.4%. The full year may still deliver. The path there is the question.
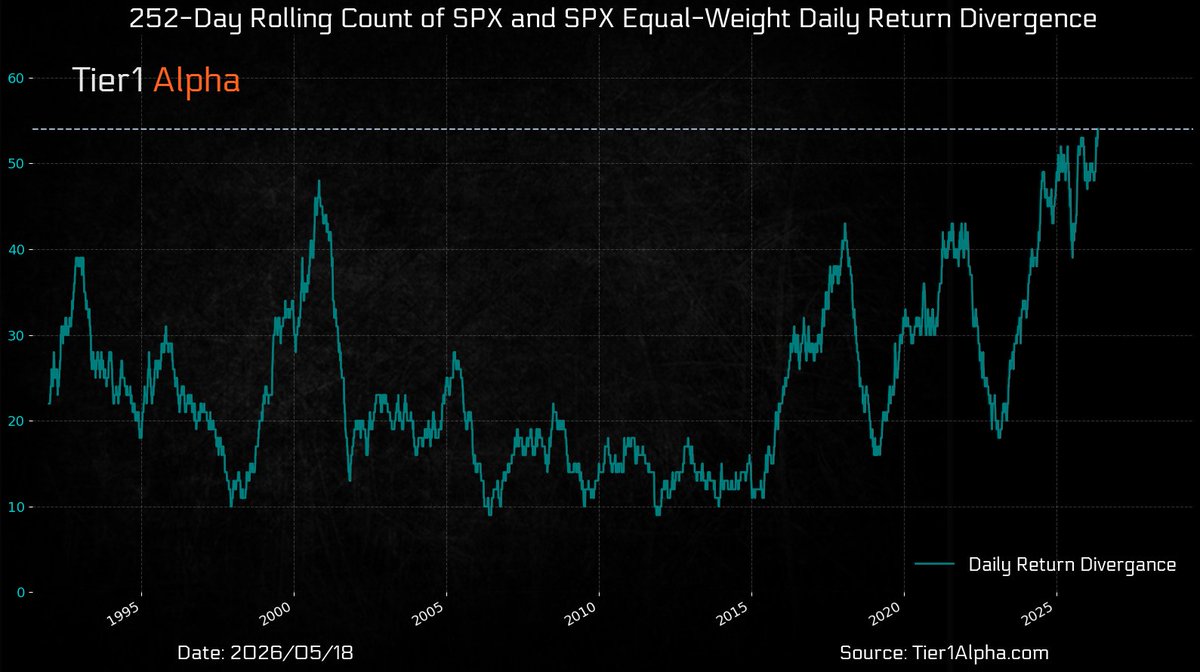
For added context, these internal divergences are becoming increasingly common, now far exceed the levels seen at the peak of the tech bubble.
When these conditions eventually unwind, they tend to do so in spectacular fashion.
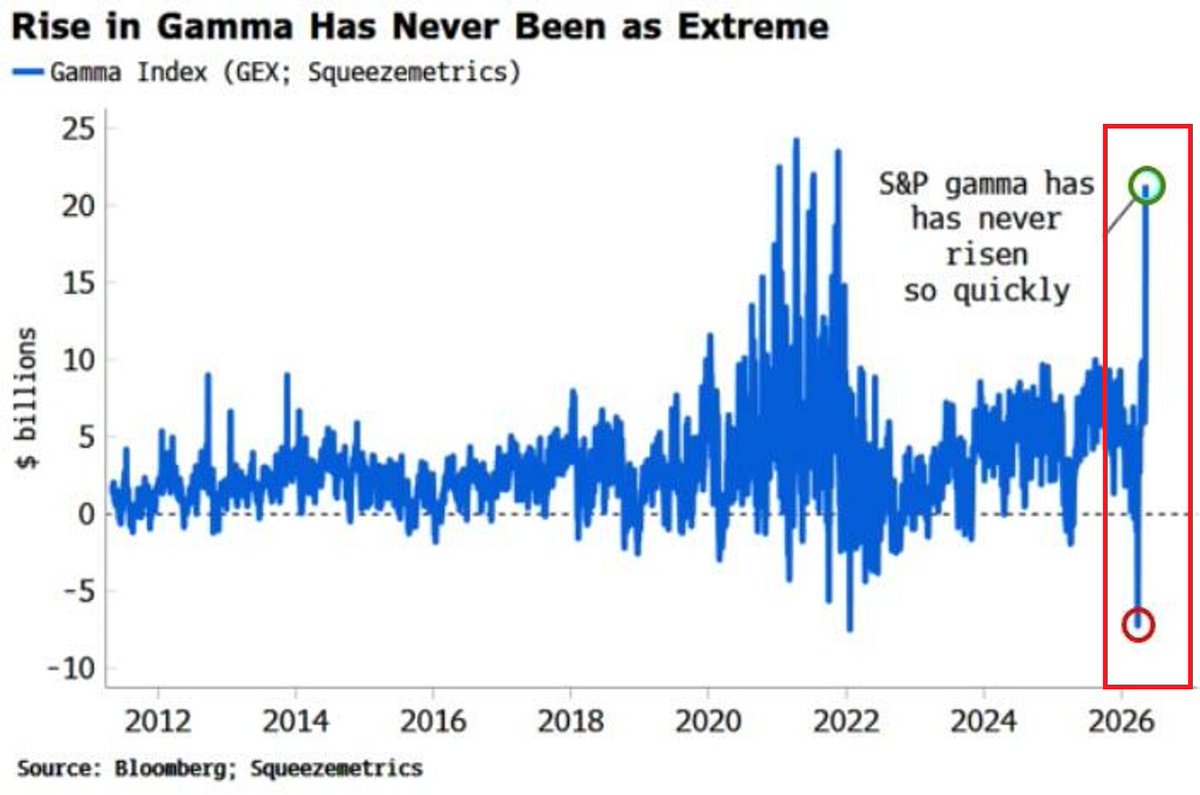
⚠️THIS IS UNPRECEDENTED:
The S&P 500 Gamma has surged from deeply negative levels at the end of March to the highest since 2021, the fastest surge EVER.
The only comparable episode was late 2021, when a similarly extreme gamma setup preceded a market top by just 1-2 months.
Gamma measures how much market makers must buy or sell in stock futures to hedge their options positions.
When gamma is positive and rising, market makers act as a stabilizing force, buying dips and selling rallies.
When it swings this violently from negative to positive, it signals an extraordinarily unstable market structure underneath a calm surface.
This has been driven by extreme speculation, particularly in the semiconductor stocks.
When a market reversal comes, it will be sharp and severe.
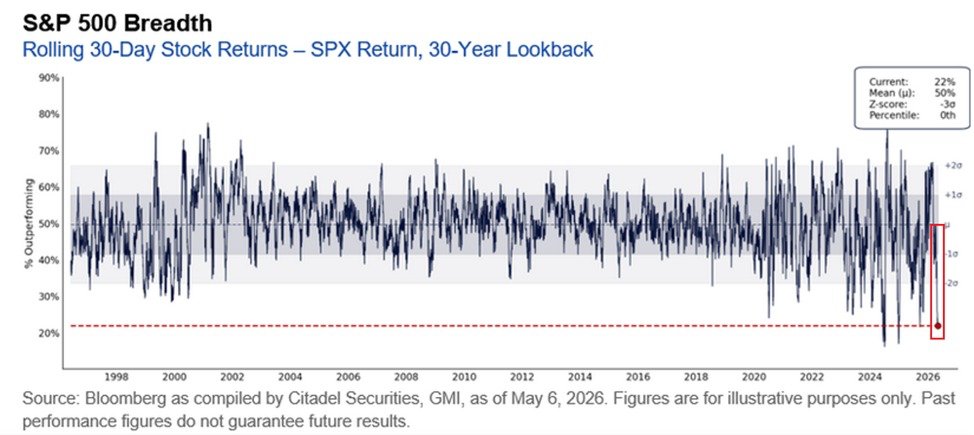
Market breadth is deteriorating:
Only 22% of stocks in the S&P 500 have outperformed the index over the last 30 days, the 3rd-lowest reading since 1996.
This is down from 65% recorded in February, the highest percentage in 8 months and less than half of the long-term average of 50%.
Over the last 30 years, there have been only 2 brief periods when market breadth was weaker, in 2024 and 2025.
This comes as the Magnificent 7 now accounts for a near-record 35% of the S&P 500’s market cap, while the top 10% account for ~40%, also shy of an all-time high.
As a result, Information Technology and Communication Services sectors represent 46% of the S&P 500’s market value.
Big tech is all that matters.