Goldman Sachs dropped the most precise map of where $7.6 trillion is going over the next five years and it tells you exactly which companies are standing in the middle of an unavoidable flood of capital (Save this).
The numbers are worth understanding precisely before talking about who benefits.
Goldman's baseline projects $765 billion in AI capital expenditure in 2026 alone, growing to $1.6 trillion annually by 2031.
Over the full 2026 to 2031 period, cumulative spend breaks down to $5.1 trillion in compute, $2.1 trillion in data centers and $358 billion in power.
Nvidia is assumed to command 75% of all compute spend throughout the period, using the Rubin VR200 chip at $80,500 per GPU as the baseline.
The data center specification charts reveal how dramatically physical requirements are escalating.
A standard cloud data center runs 5–15 kW per rack while a transitional Blackwell era AI data center runs 130–200 kW per rack.
The AI factory of the future, running Rubin and Feynman silicon operates at 500+ kW per rack, at greater than 1 gigawatt scale, with liquid cooling only.
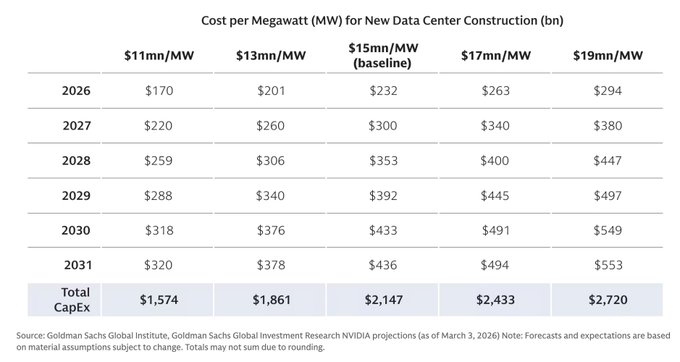
Traditional hyperscale data centers cost roughly $10 million per megawatt to build while the next generation AI data centers are being discussed at $15 to $20 million per megawatt.
Goldman identifies silicon useful life as the single biggest swing factor in the entire model.
At a 3-year replacement cycle, cumulative compute depreciation hits $3.99 trillion and at 7 years, it drops to $2.23 trillion, a $1.76 trillion difference on one assumption alone.
Power is only $358 billion of the total, but Goldman is explicit, it is the only component that can prevent the other 95% of the stack from deploying.
Now here are the companies standing directly in the path of each layer of this capital.
Nvidia is still the most concentrated bet on the compute layer.
At 75% of $5.1 trillion in compute spend over six years, that is $3.8 trillion in cumulative revenue flowing through one company's products.
The 75% gross margin on data center GPUs is the reason every hyperscaler is trying to build custom silicon to escape it while simultaneously continuing to buy Nvidia because nothing else performs at the same level.
Vertiv is the direct infrastructure play on the data center upgrade cycle.
Every rack going from 40 kW to 500+ kW needs liquid cooling systems, power distribution, and thermal management infrastructure that simply did not exist at prior density levels.
Vertiv just deepened its liquid cooling capabilities through a strategic acquisition and was named a key partner on Hut 8's large AI-focused Texas data center campus.
The liquid cooling market is growing from $5.5 billion today to $15.75 billion by 2030, and Vertiv is the dominant provider in that market.
Vistra is the power thesis in its most direct form.
The $358 billion power segment is the critical path for the entire $7.6 trillion, and Vistra has spent the last 18 months locking up that critical path through long-term nuclear power purchase agreements.
Vistra secured a 20 year agreement with Meta for over 2,600 MW of nuclear energy, plus a separate deal with AWS from its Comanche nuclear facility.
Goldman Sachs and Jefferies both upgraded the stock after the Meta deal was announced.
The architecture of this trade is simple.
Goldman's model is not a prediction of whether AI spending happens but rather a model of the minimum physical capital required to deploy infrastructure that has already been contracted, already been announced, and is already under construction.
The compute layer requires the chips, data center layer requires cooling and power infrastructure and the power layer requires nuclear at scale on multi-decade contracts.
All three layers are being funded simultaneously, and all three have identifiable public companies sitting directly in the path of the capital.
Come join Milk Road Pro and get our full $7.6 trillion infrastructure breakdown which names across compute, data centers, and power we're currently positioned in and our full thesis on the AI trade.
Link below!
1/ One of the hardest things in trading is knowing when a trend is running out of steam.
Most traders rely on price alone and that's often why they get caught buying the top or selling the bottom.
Here's a better way to think about trend exhaustion.
WARNING: Longer post (but worth reading or bookmarking for later).
Your life has seasons.
Each one is unique. Characterized by its own distinct desires, struggles, opportunities, and identity.
But one reflection I've had recently is just how easy it is to completely disassociate with the present season.
To give all your time and energy toward a longing for some nostalgic memory of a prior season or an anticipation for some beautiful state of a future season.
You look back at the past and all you see is sunshine. Because it all worked out. You forget (or glaze over) the struggle you endured. You're here today. You made it. You're alive. You're doing fine.
You look forward at the future and dream on what could be. You'll have so much more. More freedom. More purpose. More health. More deep connection. More everything.
The past is beautiful and the future feels limitless. So, logically, you slowly start to treat everything about the present as the bridge. A dash connecting your past and your future. A gap to be crossed as quickly as possible.
Everything you do today is in anticipation of some eventual end state.
I'm doing this now, so that I can have that later.
Unfortunately, the danger of that dissociation with the present is significant. You may spend your entire life living for a future that has a decidedly mirage-like property. You inch closer, but when it's right in front of you, it disappears and reappears on the horizon.
You may spend your entire life skipping through the present, deferring your presence, your joy, and your very humanity to a future that never comes.
In a classic French fable, a young boy is gifted with a magic ball of golden thread. He's told that if he simply pulls on the thread, time will leap forward. The catch, of course, is that once it's pulled, it can never be put back.
The young boy takes advantage of the newfound powers. Each time he's faced with a boring day at school, a frustrating set of chores, or a scolding from his parents, he pulls the thread, skipping through to the good parts.
As an adult, he continues, leaping through mundane struggles in his marriage, the friction of having a newborn, and the boredom at work. He finds himself pulling on the thread more and more, avoiding even the most minor inconveniences of his life.
But when he wakes up one day and sees an old man looking back at him in the mirror, he's filled with regret. He realizes in that moment that as he chose to skip through the boredom, struggles, and friction, so too did he miss the real texture of being alive.
How often do we all do the same? How easily do we default into this disassociation? Disconnecting from the present in anticipation of some future.
A mentor recently asked me this:
"Where are you going and why are you in such a rush?"
It hit me hard.
And to be honest, I haven't stopped replaying those words since he said them.
Why are you in such a rush?
The world wants you to rush into everything. Rushed decisions. Rushed conversations. Rushed relationships. Rushed timelines.
In doing so, you slowly relinquish your agency. You give up your claim on your own life. Surrender authorship to a pen that was never even yours.
In a world that wants you to rush, the ultimate act of rebellion is presence.
Be in the season you're in. Don't romanticize the past, don't fantasize the future. Be here. Be now. Be in this. All of its texture, depth, and struggle. All of its joy, tension, and pain. Sit with the uncertainty. Become friends with it. Fall in love with it.
Because every single thing you do today is something your younger self dreamed of and something your older self will wish they could go back and do.
The good old days are happening, right now.
And the next time you find yourself skipping through the present, remember these words:
Where are you going and why are you in such a rush?
🚨: Earth's core halted its rotation begin to spin in the opposite direction
Although it may seem alarming, the phenomenon has a subtle impact and is part of a cycle that occurs every 70 years.
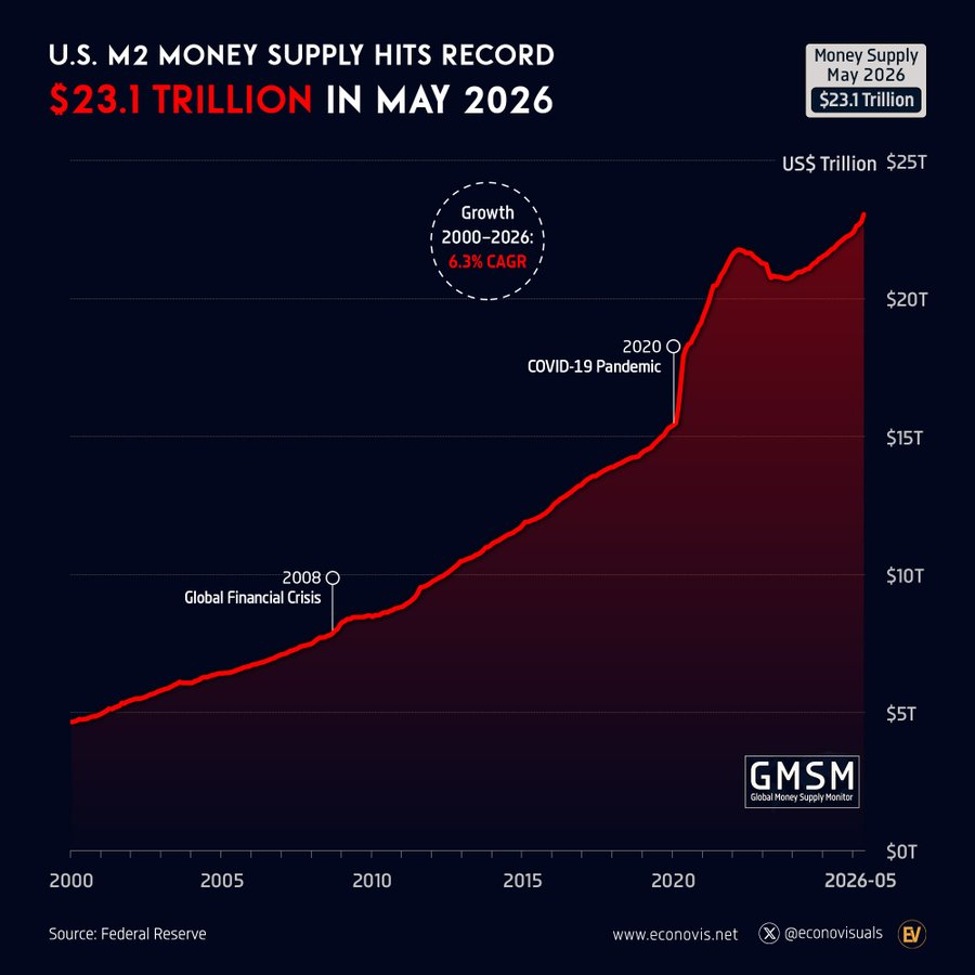
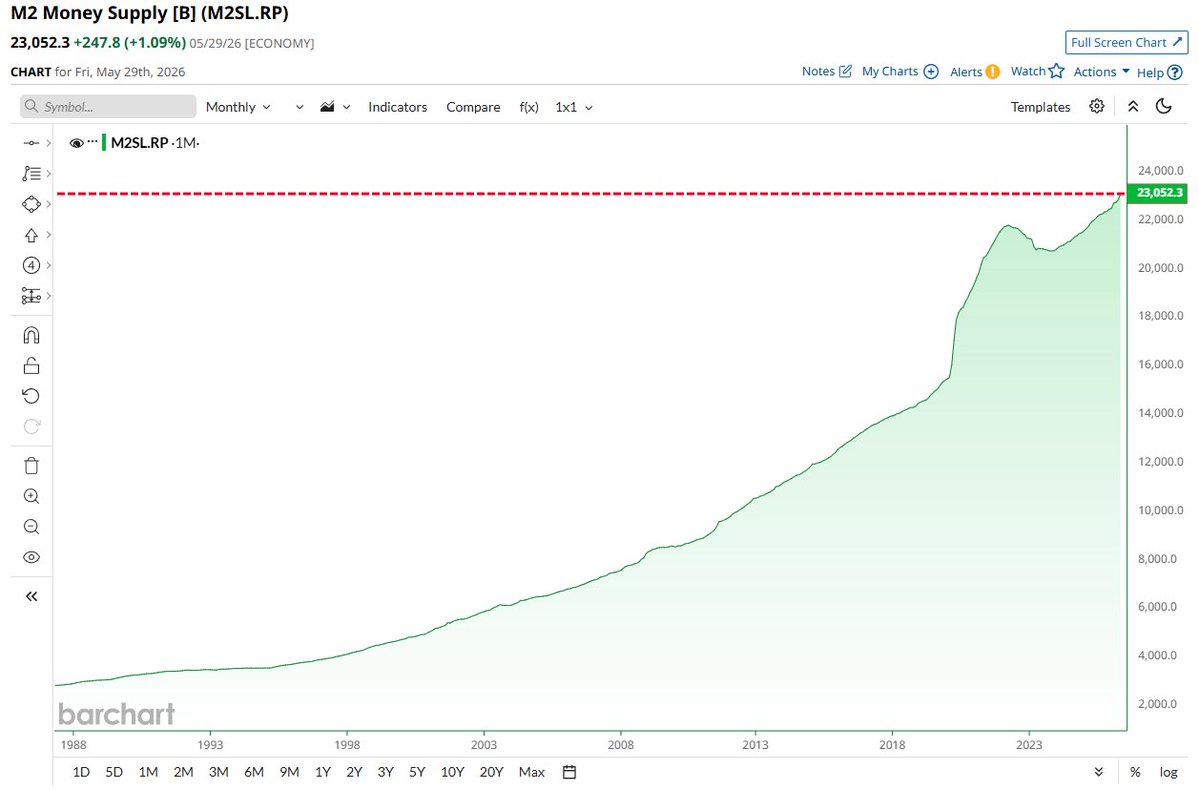
BREAKING: US M2 money supply surged +$247.8 billion in May, to a record $23.1 trillion.
This marks the largest monthly increase since May 2021.
Year-to-date, M2 has soared +$698.6 billion, the largest January to May increase in 5 years.
Money supply now stands $1.3 trillion above the March 2022 peak.
Since 2000, money in circulation has grown at an average annual rate of +6.3%.
US money creation is accelerating.
The Swiss Franc Is A Trust Barometer
The Swiss franc is one of the world’s clearest measures of institutional trust. Its strength comes from Switzerland’s neutrality, political stability, low inflation record, fiscal discipline, current account strength, high value exports, and reputation as a global private wealth center.
The franc became standardized in the 19th century, gained credibility through the gold standard era, and became especially important during periods of European stress. Over time, investors learned that when the world looks unstable, Swiss assets often become a place to hide. The franc represents safety, discipline, and continuity in a world where many currencies are tied to debt excess, inflation risk, or political instability.
Why It Acts Like A Safe Haven
The franc usually strengthens when investors lose confidence in the broader system. During the tech bust, the 2008 crisis, the eurozone debt crisis, COVID, the Russia Ukraine war, and other geopolitical shocks, capital often moved into CHF because Switzerland looked safer than the surrounding world.
That does not mean CHF rises in every crisis. The dollar can dominate during global funding shocks because the world needs dollars for debt, trade, collateral, and liquidity. The dollar is the global balance sheet currency. The franc is a trust currency.
Gold protects against distrust in paper systems. The yen often strengthens when carry trades unwind. The franc sits somewhere between them. It is still fiat money, but it carries unusually high institutional credibility.
The SNB’s Problem
Switzerland’s strength creates a problem for its central bank. When too much capital flows into CHF, the currency can become too strong for exporters, tourism, and domestic inflation. A strong franc lowers import costs, but it can also squeeze corporate margins, pressure wages, and create deflation risk.
That is why the Swiss National Bank has repeatedly intervened. The famous example was the 1.20 EUR/CHF floor introduced in 2011 during the eurozone crisis. The SNB tried to stop the franc from becoming too strong by buying foreign currency. When it abandoned the floor in 2015, the franc surged and global FX markets were shocked.
The lesson was simple. Even a credible central bank can struggle when global capital wants safety badly enough.
What The Current Chart Is Saying
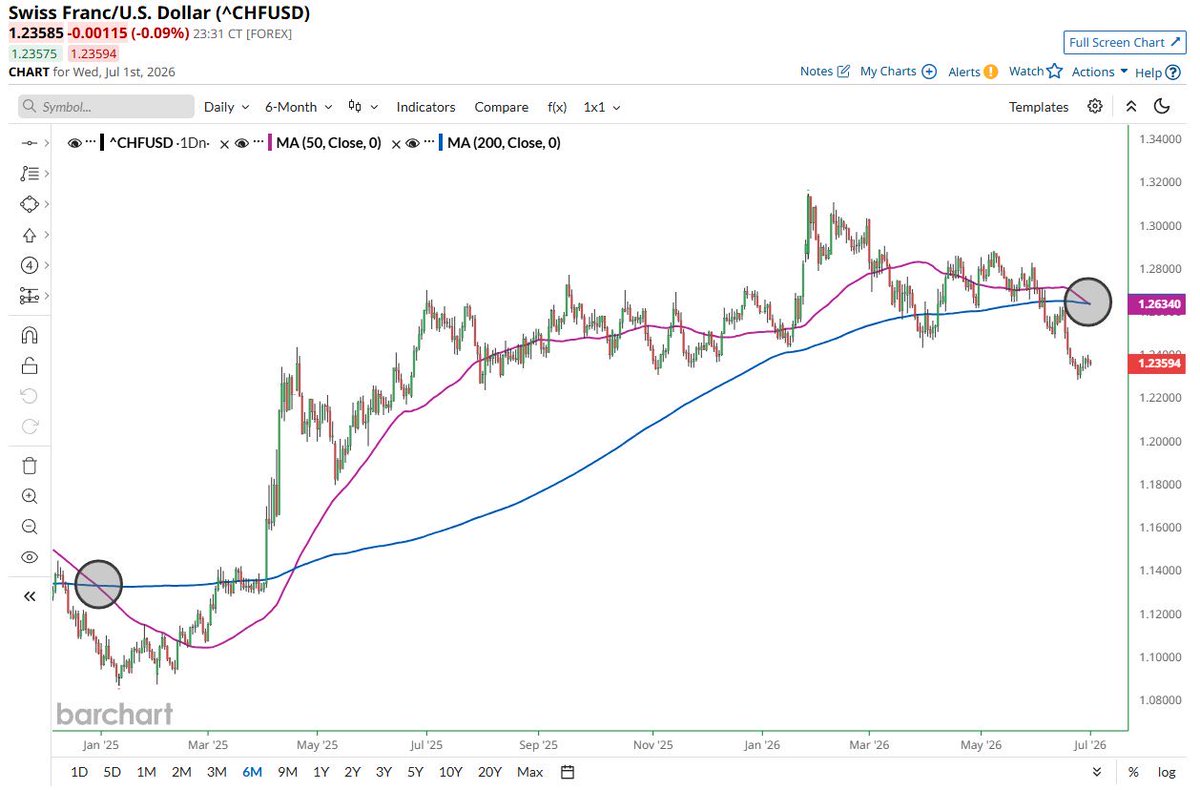
The chart is CHF/USD, meaning it shows how many U.S. dollars one Swiss franc buys. When the chart falls, the franc is weakening against the dollar.
The death cross means the 50 day moving average has moved below the 200 day moving average. It is not magic, but it does show short term momentum has rolled over. In this case, it suggests the franc’s safe haven momentum against the dollar is cooling.
That does not mean Switzerland is suddenly weak. It means the dollar is currently louder. Higher U.S. real yields, dollar funding demand, U.S. rate advantage, and reduced immediate panic can all push CHF lower versus USD even if the franc remains structurally strong.
What CHF Signals
A rising franc usually says investors are nervous. It can point to eurozone stress, banking stress, geopolitical fear, weak risk appetite, or falling trust in risk assets.
A falling franc can mean risk appetite is improving, the SNB is resisting excessive strength, or the dollar is dominating global flows. Context matters. CHF weakening versus the dollar but holding up versus the euro is different from CHF weakening everywhere.
If CHF rises with gold, Treasuries, and volatility, markets are moving toward safety. If CHF weakens while equities rise and credit spreads stay calm, fear is fading. If CHF weakens only because the dollar is surging, the signal is less about Switzerland and more about global dollar pressure.
The death cross signals cooling safe haven demand against the dollar, not collapsing Swiss credibility. The franc still matters because it shows where global trust is flowing.
📊 Tomorrow's Macro Roadmap
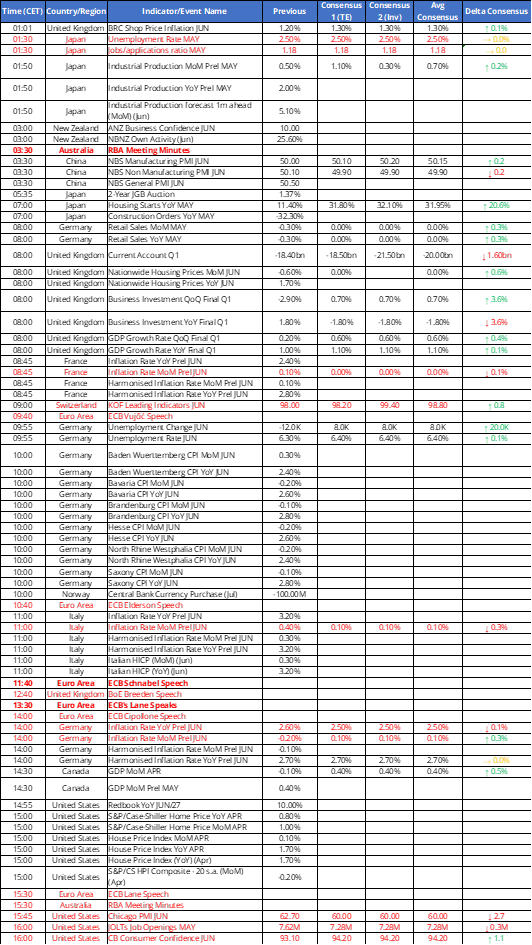
🇪🇺 Euro-area flash CPI day: France (08:45), Italy (11:00) & Germany (14:00) report June inflation — German print is pivotal, with forecasts unusually wide ahead of the ECB's July meeting.
All kids need to watch this!
The speech emphasizes accountability and courage. He tells his son that blaming others for failure is what cowards do. Real strength comes from accepting hardship, believing in your worth, and continuing to fight.
Everyone faces disappointment.
When Smart Money Starts Selling the Winners
The Goldman Prime Services chart shows extreme institutional selling in US Info Tech stocks week ending June 25. The final print near a -4 Z-score means selling was roughly four standard deviations worse than weekly flow in Goldman’s prime book. That is not routine trimming. It is among the most aggressive negative readings shown from 2017 to 2026.
This does not prove a crash. It is one prime broker’s book, not the whole market, and it measures flow, not total positioning. The move could reflect long liquidation, added shorts, sector rotation, or lower gross exposure. But the timing matters because it hit the most crowded leadership group after a huge AI and tech rally.
Why It Matters
The simple explanation is profit taking. Tech and AI winners carried much of the market, so funds may have locked in gains near quarter-end. That is plausible, but incomplete. A -4 reading this late in the cycle, while the real economy weakens underneath, looks more like de risking than normal rebalancing.
Institutions often sell what they can, not always what they want to. Tech is liquid and full of embedded gains. When macro risk rises, those positions become the easiest source of cash. Leadership often gets distributed before the broader index admits the cycle has changed.
AI And Macro Risk
The equity market phase of the AI trade may be changing. AI can be real while AI stocks are still priced for perfection. Current earnings do not need to collapse for the trade to become vulnerable. Expectations only need to be too high, positioning too crowded, and the macro backdrop too tight.
That is where the real economy matters. Labor revisions weakened the prior jobs narrative. Consumers are more strained. Delinquencies are elevated. CRE refinancing pressure is intense. Bankruptcies are rising. The Fed is still constrained by inflation rather than free to rescue risk assets. If the economy were accelerating and the Fed were easing, this could look like a harmless reset. In this backdrop, it looks more serious.
The Cycle Signal
This looks less like healthy mid cycle rotation and more like late cycle distribution. The market has not fully broken because credit spreads have not exploded. But tech leadership no longer looks like an untouchable one way bet. Institutional money appears to be reducing exposure to the most crowded, profitable, and macro sensitive leadership group.
The bullish case needs a sharp reversal in flows, stronger breadth, stable credit, and falling yields. The bearish confirmation would be continued tech selling, wider credit spreads, weaker earnings revisions, rising VIX, and more deterioration in labor and consumer data.
The likely message is that they know the easy part of the AI led rally is over. When selling reaches this extreme while the real economy is already weakening, the correct read is caution. This kind of evidence often appears before the public narrative shifts from profit taking to rotation, then to earnings risk, and finally to recession risk if credit and labor break.
Jeff Gundlach warned that the U.S. Govt. may lower coupons and extend maturities on its debt to avoid default or inflation. I've warned about this for over a decade. So you go to sleep owning a 2-year T-note with a 4% coupon and wake up owning a 30-year T-bond with a 1% coupon.
Hey @jschultzf3, this is for you mon frère.
Most premium sellers think holding to expiration = max profit.
The data says you're destroying your edge in the final 3 weeks.
Here's what gamma does to your trade after 21 DTE 🧵
(please 👍 and 🔁 if you find this useful)
What just happened?
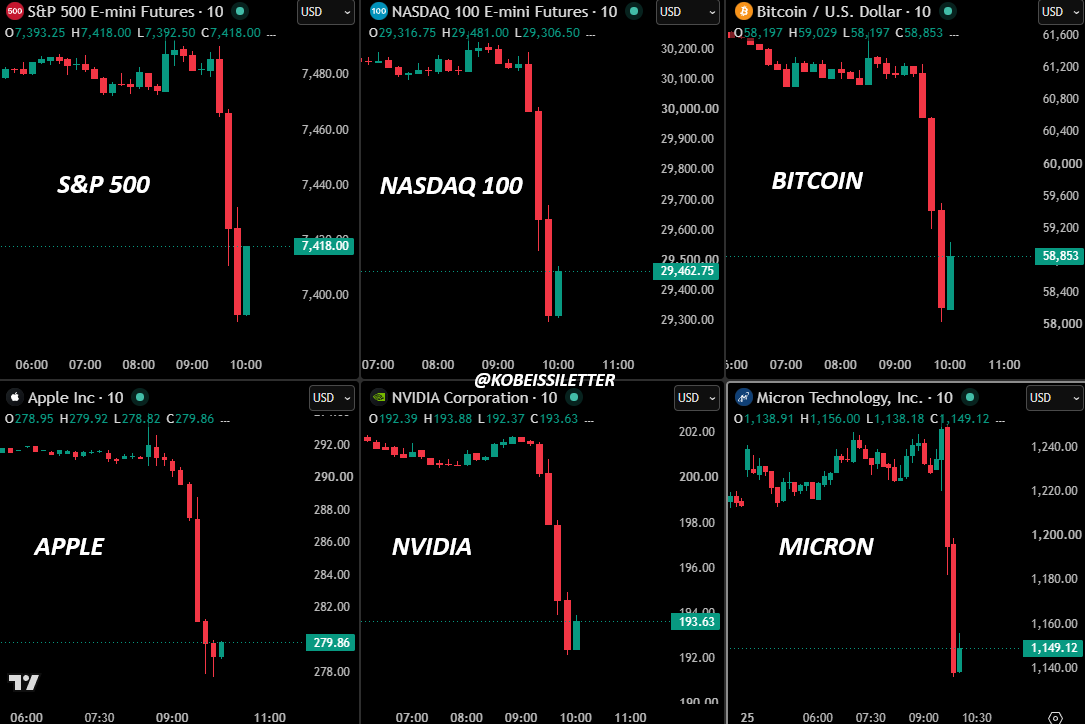
In just 27 minutes, the Nasdaq 100 just fell -1,000 points and the S&P 500 erased -$1 TRILLION without any major headlines.
The Nasdaq opened +1% higher then fell -3% between 9:30 AM and 9:57 AM ET.
What does it all mean? Let us explain.
(a thread)
Microsoft shares are poised for their worst monthly loss since 2008, having plunged nearly 19% so far in June. Oracle is down 30%, Meta down 12%, Google down 8%. And yet the S&P 500 equal weight index is up 1% on the month.
China's imports of gold are up (Switzerland) and everyone is spending a lot more on imported chips and imported energy ...
Machinery imports jumped in q1 but that now seems to be faltering
1/