I've been developing for years and posted almost none of it. Part of it is never really knowing what the point of posting was.
Here's the point I landed on: I pay monthly for apps that are supposed to help me sleep, move and eat well. That's a strange arrangement. So I started building my own instead. Free ones.
I'm going to show some of the work here.
Moved my day/night line onto the real numbers: 0.83 degrees below the horizon for refraction, 18 for the end of astronomical twilight.
The cloud layer then had to lag 3.21 degrees, because at 10 km the horizon sits lower. That is why the sky still burns after sunset.
@DemiClawOne I was thinking about the ephemeris data, would be a good addition to geophysical dashboard. But I decided it to save it for later.
Regarding the circles, I guess you mean the sub & sublunar point, the direct position of the sun and moon displayed on the globe.
@DemiClawOne Ahh yes, that's true. But to be fully honest, it's all computed rather than simulated.
I created an animated shader overlaying the globe using a formula Meeus outlines to find the length of a day.
Thanks for reaching out. Yes, though as a side project. It sat on my machine a long time and only went public recently. The last big update added sun and moon positions, their tracks across the earth, and the eclipse shadow, all computed (Meeus) rather than simulated.
Current work is the magnetosphere layer on IGRF-14 and Tsyganenko T89. Everything on screen has to be measured and carry its source.
The one thing I cannot check myself is whether the picture matches the numbers. But it started to look real good. The physics validates against published reference cases.
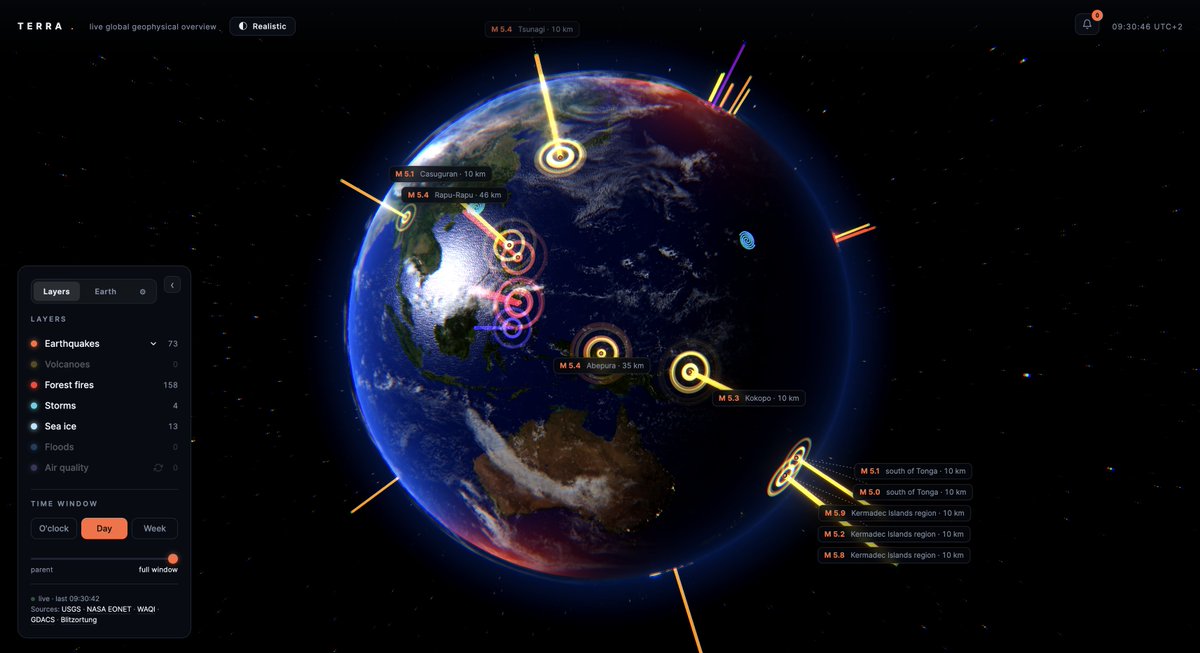
The visual I have no way to score. Would you be interested in taking a look? The screenshot gives the idea.
@DemiClawOne@StefanBurnsGeo Thanks for the feedback. Please have fun playing around with the demo, stand-alone file or repo.
I suggest to start here https://t.co/cGjHAzBWFk I’ll also add a link to my repository. I’m curious what elements you find most interesting?
@juminoz@threejs Looking good. Tried my self one time but ended up in using to much compute to render realistic clouds. How is your performance while running it? Did you had to go around some of limitations?
Got it, thanks for clarifying.
I’ve just updated the tool: USGS and EMSC are now strictly separate options (you can’t enable both at the same time), and the labelling is fixed.
If you ever have a spare minute and spot something that still feels off or could be clearer from an EMSC perspective, I’d be glad to hear it.
I built the globe to see whether the earthquakes in the news are the big ones. I was reading a thin catalogue before.
Past week, M3+ and up, one checkbox apart: USGS 283 events vs. EMSC 907.
Neither is wrong. Terra reads both now, and merges the overlap. See for yourself⬇️
I wanted to know whether the earthquakes that make the news are the big ones.
So I built a globe. USGS and NASA feeds, colour by depth, filter by magnitude, scrub back seven days.
Three.js, one local HTML file. Still the thing I open most frequently.
@AstronomyNow Don't be late, Once the shadow reaches Spain. The umbra is already moving at roughly 3400 km/h by then. That’s why even on the centre line you’re looking at roughly a minute and a half at best.
@MatthewCappucci The low sun altitude in Spain makes the umbra geometry especially unforgiving. The whole event is gone before you know it. Entering Spain around 20:26 and leaving Mallorca around 20:31. Special nonetheless. Curious about the sunset when the eclipse almost fades into Twilight.
Orientation, mostly. Speed and density I can take from a propagation, but the clock angle decides how much of it actually couples in.
What do you score the arrivals against once they are in, and how soon after?
For now I use most data from GOES but I will have a look at WSA-ENLIL too.
The total solar eclipse on 12 August sent me back into Terra. Spent an evening on a shadow that dimmed the earth 1.1% where it should have been 94%.
I had reused the maths from the day/night terminator. A gradient hides a few degrees of skew. A shadow edge does not.
@LastQuake Also noticed a labelling error on my side: I had USGS as global and EMSC as Euro-Med detail. that was backwards and a artefact from older versions. Fixing that too!
@LastQuake Fair point, no need to merge if USGS is already one of your 120 contributing networks.
I’ll keep both as separate options for now (and disable enabling both at once).
Out of curiosity: if you were matching external events against your feed, what would you key on?
@mathelirium What are the orange and blue mapping to? I keep going back and forth on how to colour plasma quantities so they stay readable rather than just pretty.