Be the most competitive!!
Competitiveness isn't just a personality trait-it's a decision. It's not about talent or size but about desire. You have the ability to choose your level of competitiveness.
@BallisPsych
Choosing a statistical test is one of the challenges students and early researchers face. Let me summarize this paper in 5 minutes.
The right statistical test usually depends on these core questions:
→ What is your outcome variable?
→ Are your groups paired or unpaired?
→ Is your data continuous, categorical, or binary?
→ If continuous, is it normally distributed?
Once you answer those, the fog starts to clear.
⸻
1️⃣ Start with the type of variable
Ask yourself:
→ Is the outcome continuous?
e.g., blood pressure, weight, test score
→ Is it categorical/binary?
e.g., yes/no, success/failure, disease/no disease
That single distinction already removes much of the confusion.
⸻
2️⃣ Then ask: paired or unpaired?
This matters more than many students realize.
→ Unpaired = two different groups
→ Paired = the same subjects measured twice, or matched observations
If you miss this step, you may choose the wrong test even when the variable type is correct.
⸻
3️⃣ If the outcome is categorical
Think along these lines:
→ Chi-square test
→ Fisher’s exact test
→ McNemar test for paired categorical data
This is why chi-square does not belong everywhere.
The data structure decides.
⸻
4️⃣ If the outcome is continuous
Now the next question is:
→ Normally distributed?
or
→ Not normally distributed?
That determines whether you use:
Parametric tests like:
→ t-test
→ ANOVA
Or non-parametric tests like:
→ Mann–Whitney U
→ Wilcoxon signed-rank
→ Kruskal–Wallis
→ Friedman test
⸻
5️⃣ Do not choose the test after seeing the data
This is one of the most important reminders in the paper.
The statistical test, the null hypothesis, and the significance level should be specified before the study is carried out.
That protects the integrity of the analysis.
⸻
6️⃣ Most papers do not require you to know every test
You can interpret a large proportion of medical research papers if you understand:
→ t-test
→ Chi-square test
→ Fisher’s exact test
You do not need to master everything at once.
You need to master the logic.
⸻
7️⃣ The real skill is learning how to think through the decision:
→ What is the question?
→ What is the endpoint?
→ What is the data type?
→ What is the study design?
Once that becomes clear, the test often becomes obvious.
⸻
💬 Which statistical test confused you the most when you were starting?
———-
Reference:
du Prel JB, Röhrig B, Hommel G, Blettner M. Choosing Statistical Tests. Deutsches Ärzteblatt International. 2010;107(19):343–348.
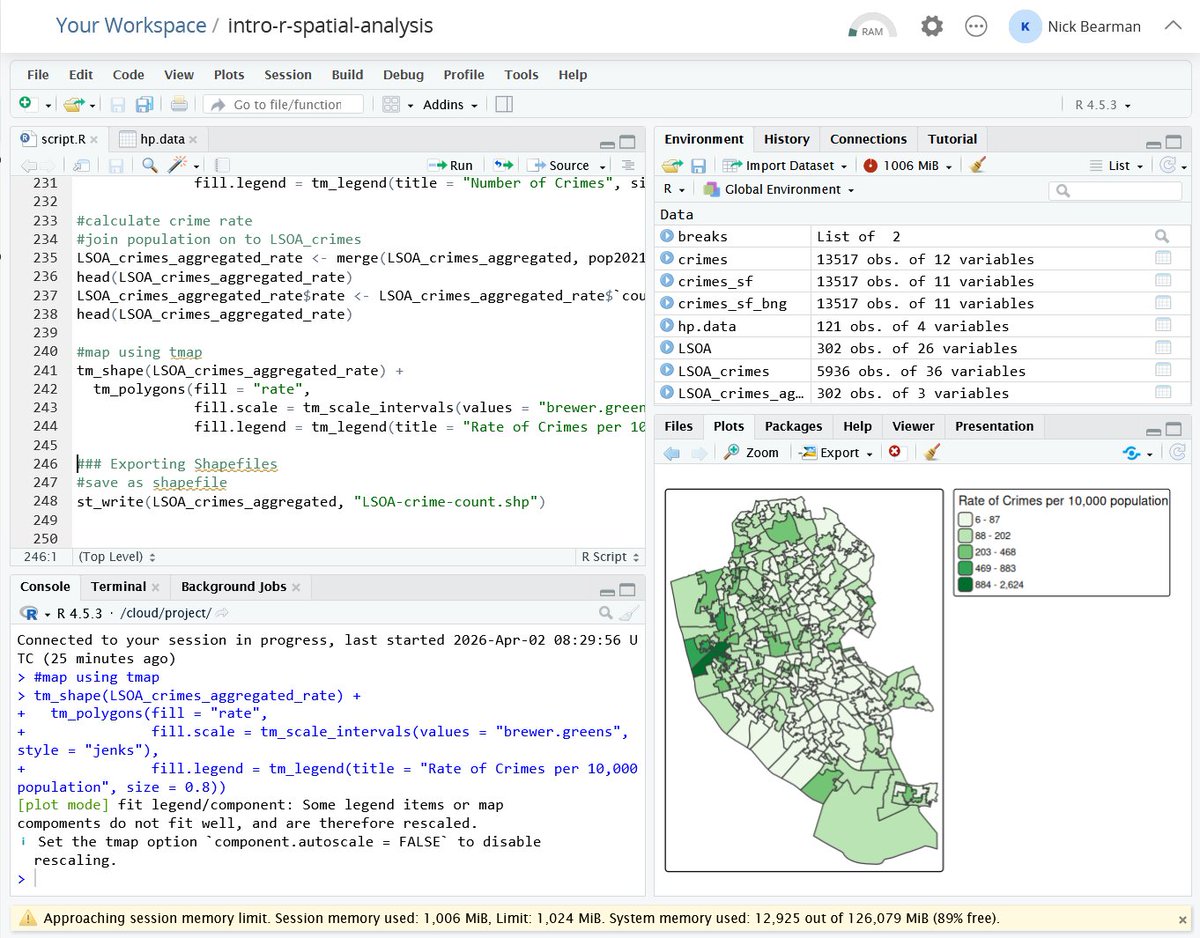
Just testing out my material in https://t.co/VuDqzXwXWv for my Introduction to Using R as a GIS course coming up on 28 & 29 April https://t.co/RYP1cGz462. https://t.co/VuDqzXwXWv is a great way of running R if you can't install it yourself! More details at https://t.co/Q54DKOhg1W
Just received a proof copy of my new GeoAI book from Amazon! The printing quality is very good. It is now the #1 best-seller in GIS, Remote Sensing, and Computer Programming Languages. Grab your packpaer copy here: https://t.co/03KbrDXord
PDF edition available in English, Spanish, Chinese, French, and German: https://t.co/i039IxTV6U
#geospatial #geoai #opensource
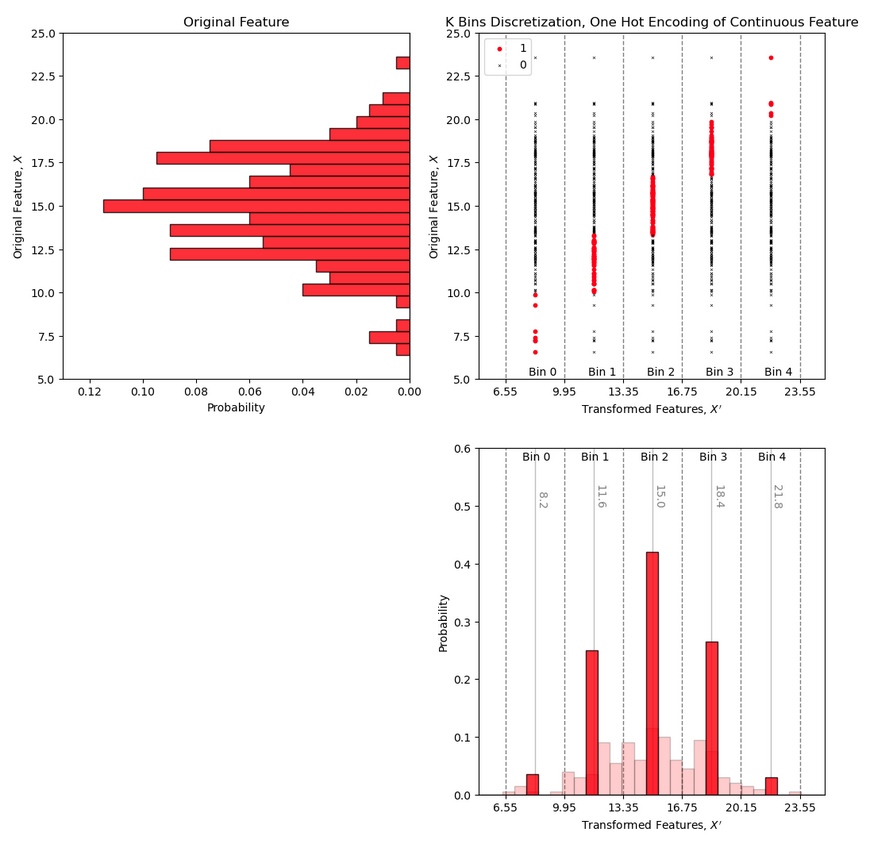
Categorical data represents variables that take values from a finite set of discrete categories, such as labels or classes. Mathematically, a categorical variable X ∈ {1,…,K} is modeled using a probability vector p = (p₁,…,p_K), where ∑ p_k = 1 and P(X=k)=p_k. A common representation is one-hot encoding, where each category is mapped to a binary vector. In statistics, categorical data is analyzed using models like the multinomial distribution and tools such as contingency tables and chi-square tests. In machine learning, it is used in classification tasks, with models like logistic regression and softmax outputs: P(Y=k|x)=exp(z_k)/∑ⱼ exp(z_j). In real life, categorical data appears in surveys, medical diagnosis, recommendation systems, and customer segmentation, where understanding discrete group behavior enables better decisions and predictions.
In 2019, MIT professor Patrick Winston gave a legendary 1-hour lecture called “How to Speak.”
It has 18M+ views for a reason.
His frameworks:
• Your ideas are like your children
• The 5-minute rule for job talks
• Why jokes fail at the start
15 lessons on communication:
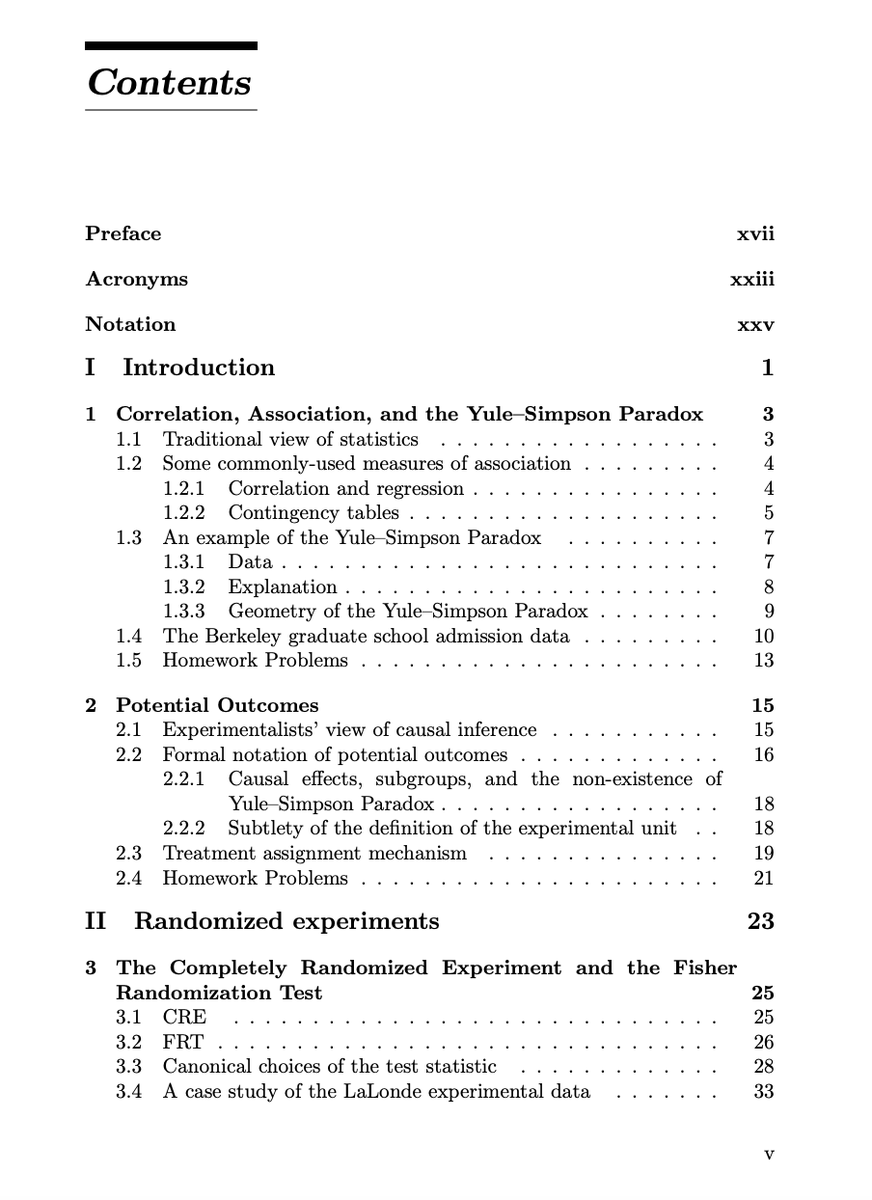
A First Course in Casual Inference by Peng Ding
PDF: https://t.co/FjmC3nBQ9G
So many guys nowadays are eager to learn state-of-the-art theory and methods in causal inference so that they are better equipped to solve problems from various fields.
This is a good book. It covers:
- Correlation, Association, and the Yule–Simpson Paradox
- Potential Outcomes and the Experimentalist's View
- Treatment Assignment Mechanisms
- Completely Randomized Experiments (CRE)
- Fisher Randomization Test (FRT)
- Canonical Choices of Test Statistics
- Basic Probability Theory and Statistical Inference (Prerequisites)
- Linear and Logistic Regressions
- Neyman's Potential Outcomes Notation
If you're still using raw R outputs for presentations, it's time for an upgrade! Tools like gtsummary bring your statistical results to life, making them much more digestible for non-technical audiences.
While base R functions like summary(fit) work well for statisticians, they can be too complex for stakeholders who aren’t familiar with the detailed output. The tbl_regression() function from gtsummary makes it easy to present regression results clearly.
In addition, gtsummary is highly versatile - it’s not just limited to linear regression. You can apply it to generalized linear models, survival analyses, and more. The package even allows you to include p-values, confidence intervals, and other important statistics directly within the tables, helping you to better communicate statistical results.
Here are a few standout benefits:
✅ Simplified output that’s easier for stakeholders to understand
✅ Works seamlessly with a variety of models
✅ Customizable tables with key statistics like p-values, confidence intervals, and more
The visualization included here was originally shared in a post by Dr. Alexander Krannich. Thanks to Alexander for inspiring me to create this post.
Interested in more tips on data science, statistics, Python, and R? Be sure to sign up for my free email newsletter! Click this link for detailed information: https://t.co/ktUcWo9XpO
#programming #datasciencetraining #DataAnalytics #RStats #R4DS #Rpackage
Pen & Paper Exercises in Machine Learning by Michael U. Gutmann
Book PDF here: https://t.co/FUo4Nb3SIo
This book is a collection of (mostly) pen-and-paper exercises in machine learning. Each exercise comes with a detailed solution.
The following topics are covered:
- Linear algebra
- Optimisation
- Directed graphical models
- Undirected graphical models
- Expressive power of graphical models
- Factor graphs and message passing
- Inference for hidden Markov models
- Model-based learning (including ICA and unnormalized models)
- Sampling and Monte-Carlo integration
- Variational inference
Repo: https://t.co/OZ219CXvmQ
Introduction to Computational Thinking and Data Science by MIT
You can access Lecture PDFs: https://t.co/mG5MLOmye3
Lecture Videos: https://t.co/lM3W1UTYV1
I’m STOKED to share a new chapter on Monte Carlo Simulation (MCS) in my free, online e-book, Applied Geostatistics in Python! 🤘📘
To better support my students (and the broader community!), I added hands-on, well-documented Python demos with reproducible code to help anyone get started with #DataScience, uncertainty quantification, and simulation. 🧠📊💥
I love building resources that make learning practical, accessible, and empowering — and I’m STOKED to help! 🙌🔥
Check it out here:
👉 https://t.co/9iBVbYnBcX
In my new free, online #DataScience e-books, I focus on creating effective and impactful visualizations.
The first step I take is always to ask: What message am I trying to communicate with this plot? From there, I design the plot specifically to make that message clear and intuitive. Rarely are my visuals the default, generic plots—each one is crafted to enhance understanding and engagement. See my ideas for model and #dataviz with,
Applied #MachineLearning in #Python: https://t.co/pq4eWwjPQQ
Applied #Geostatistics in Python: https://t.co/KFHZgbnbW0


![KirkDBorne's tweet photo. A First Course in Causal Inference: https://t.co/Ew9PcMQ8Ff [490-page PDF download]
+ Also see the book "Causal Inference in Statistics: A Primer" at https://t.co/ROEZZZAFqN by @yudapearl
#Probability #Mathematics #DataScience #ML #MachineLearning #DataScientist #DataAnalysis https://t.co/N48JB8W3I6](https://pbs.twimg.com/media/HE88A9XX0AAgiuM.jpg)