If MTK TPU succeeds, SMTC is a 2-4x from here.
If MTK TPU fails, SMTC is a 1.5-2x from here.
SMTC CTLE can give 4-7 dB SNR gain. ~300G SerDes at PAM6 has 4-5 dB SNR penalty from theory. MTK would need 2-4 dB improvement in design + CPC + SMTC CTLE + good EMIB pkg to make it.
Memory pooling will no longer be a luxury, it will be a financial necessity
A single VR200 rack will require $2M+ in memory components, a 435% increase from the current gen
Data Centers with huge clusters literally cannot afford to let a single byte of memory sit idle or get stranded or you’re bleeding millions in potential revenue generating capital
Think about it
If a data center has a 30% "stranding rate" (industry average), that means out of every single rack they buy, $600,000 worth of memory is sitting completely idle at any given second
Now multiply that across a 10,000 rack hyperscale data center, and you are looking at $6 billion in completely wasted, non revenue generating capital
CXL memory pooling decouples the memory from the server, then the servers draw EXACTLY what they need from a shared, flexible pool ensuring 100% utilization at all times
That way no memory sits idle & no capital is wasted
You will hear a lot more about memory pooling in the future anon
$PENG $ALAB
Private Credit
@kieranwgoodwin@boazweinstein@junkbondinvest@TruthGundlach@jimcramer
Private Credit – Structure Matters
There has been a lot of recent commentary around the current “risks in private credit.” A few structural points are worth clarifying.
1. Who actually owns private credit
Banks do not “own private credit.” If anything, the expansion of private credit over the past decade occurred partly because banks pulled back from direct lending after the Global Financial Crisis. Banks do LEND to BDCs which I will discuss below.
The capital base today is overwhelmingly institutional:
Pension Funds ~35%
Insurance Companies ~25%
Sovereign Wealth Funds ~20%
Family Offices / Endowments ~10%
Retail ~10%
Retail investors are the only group that tends to react quickly to short-term volatility exacerbated by some of the folks above. Institutional capital generally operates with long-duration liabilities and multi-year investment horizons. With 95%+ of the Financial News media Equity Focussed and being the least informed this is creating an opportunity.
2. Public BDC trading does not force asset liquidations
-Public Business Development Companies are often cited as evidence of stress in private credit, but this reflects a misunderstanding of structure.
-Public BDC stock prices trade second by second, but the underlying loans are not mark-to-market trading assets. Portfolio values are determined through periodic valuation processes and loans are generally held to maturity.
The key legal constraint for BDCs is the Asset Coverage Ratio (ACR). The ACR functions as both an incurrence and maintenance covenant and is required by law for all BDCs and RICs.
Typical BDC structure example:
Average BDC
ACR: 167% (above the legal requirement of 150%)
Debt / Equity: 1.5x
Example BDC balance sheet:
Assets -$1.0B portfolio of first-lien senior secured loans
Capital structure
$300M Senior Debt – JPM 5-year facility
$300M Senior Unsecured Debt – Wells Fargo 6-year facility
$400M Equity ( $OBDC, $FSK, $ARCC etc etc)
With roughly 40% credit support, senior debt would only be impaired after extremely large realized portfolio losses.
In this structure:
Wells Fargo unsecured debt would require $401M of losses before impairment
JPM secured facility would require $701M of losses before impairment
For the equity to trade at 75% of NAV, the market would effectively be pricing something like:
25% immediate default rate with zero recovery, or
50% default rate with 50% recovery
Those are extremely aggressive assumptions for portfolios composed primarily of first-lien senior secured loans.
3. Historical credit experience
Historical credit cycles provide useful context.
During the 2008–2009 Global Financial Crisis:
Peak senior secured loan default rate: 10.7%
Three-year cumulative default rate: 15.1%
Average recovery rate on first-lien loans: ~64.7%
These numbers imply realized losses far smaller than what current equity pricing in some public BDCs appears to assume.
Even during the most severe credit crisis in modern markets, senior secured loan recoveries remained substantial.
4. Sector concerns and portfolio composition
Software lending has become a meaningful portion of private credit portfolios and is currently under scrutiny.
However, several structural realities matter:
Many private credit portfolios consist primarily of first-lien senior secured loans
Average loan-to-value ratios are around 50%
Loans typically include maintenance covenants
Borrowers usually have significant equity cushions
Software exposure might represent ~15% of a portfolio, which means an extreme scenario would require:
-the entire software segment to default immediately with no recovery, plus
-additional defaults across the remaining portfolio
In practice, credit cycles involve restructurings, workouts, and recoveries. Loss outcomes are rarely zero-or-one events.
5. Public market vehicles represent a small portion of private credit
Publicly traded vehicles are often used as proxies for the entire private credit market, but they represent only a small slice of the capital base.
For example, Blackstone manages approximately ~$1.3T across more than 1100 separate investment vehicles. Ie- Commercial Real Estate, Private Equity, Asset Based Lending, Structured Lending, Insurance, Infrastructure etc etc
Breakdown of structures:
Perpetual / Evergreen capital (mostly private):
~$525B or 41% of total AUM
Private drawdown funds:
~$751B or 59%
Publicly traded vehicles:
Only six vehicles ($BXSL, $BXMT, $BSL, $BGX, $BGB, $BGLF) Total AUM across these public vehicles:~$32B
and $BXSL and $BXMT represent roughly 98% of that $32B.
In other words, the overwhelming majority of Blackstone’s credit platform sits inside private or perpetual capital structures that are not subject to daily public market pricing.
6. CLO history provides additional perspective
Structured credit markets provide another historical example.
During the Global Financial Crisis:
CLO structures used ~12x leverage through the equity layer. There were roughly 6,100 CLO tranches outstanding. Only 25 tranches defaulted
CLO debt experienced virtually no impairments or losses during that period.
Following the crisis, structures improved significantly:
CLO 2.0 (post-2010)
Lower leverage
Stronger over-collateralization tests
Stronger interest coverage tests
Today’s market is operating under CLO 3.0 structures, which generally include even more conservative protections.
7. Valuations and market repricing
Alternative asset manager valuations had become elevated across several platforms.
A repricing of those valuations is not unusual during periods of macro uncertainty.
However, the structural foundations of private credit remain grounded in:
senior secured lending
covenant protection
diversified portfolios
institutional capital bases
Periods of volatility often create opportunities rather than systemic impairment.
8. Structure matters
For senior BDC debt to experience impairment, the underlying portfolio would need to suffer extremely large realized losses.
With typical BDC leverage of 1.5x debt to equity and roughly 40% credit support, portfolio losses would have to exceed 40% before senior debt impairment becomes possible.
That scenario is equivalent to something like:
80% immediate default rates with 50% recovery, or
similar extreme combinations of defaults and recoveries.
Historical data suggests outcomes of that magnitude are extraordinarily rare for diversified portfolios of first-lien senior secured loans.
Closing Thought
-Credit markets ultimately come down to structure, underwriting discipline, and recovery dynamics.
-Public market sentiment can move quickly, but the economics of secured lending tend to play out over much longer time horizons..years not days!
-Scale, diversification, and long-duration institutional capital provide structural advantages that daily market pricing often fails to capture.
Disclosure- I am long and an opportunistic buyer of select higher quality BDCs / BDC related liabilities / CLO debt / Bank RCR
BofA (Bank of America) analyst Vivek Arya concluded that it doesn’t make logical sense for the chip sector and the software sector to sell off together. He argued that a decline in chip stocks implies deteriorating AI investment returns (ROI), while a decline in software stocks implies AI adoption will become extremely widespread—so those two conclusions are hard to reconcile at the same time. In his view, the market is overreacting.
Arya noted that the market’s implicit judgment behind the selloff in AI-related chip stocks is that “AI investments have deteriorated to the point where achieving ideal returns is difficult, limiting future growth runway.” By contrast, the selloff in software stocks reflects a different judgment: “AI adoption will be broadly disseminated and meaningfully boost productivity, replacing software businesses and application business models.”
Arya wrote that “these two outcomes cannot occur simultaneously.” He said this positioning resembles the fear seen during the “DeepSeek shock” in January this year—an episode that ultimately proved to lack factual grounding. At the time, the market worried that DeepSeek could build competitive models at lower cost, reducing demand for high-performance chips.
Arya believes what the market actually witnessed after the “DeepSeek shock” was more AI spending and accelerated growth in AI tokens. In his report, he estimated that 2025 cloud capex growth could reach 69%, far above the initial expectation of 20–30%.
He also argued that even if current AI models are highly capable, it may still take years to truly “prove value” from a productivity standpoint—so he does not expect AI investment to slow in the near term. Even if a major productivity breakthrough emerges in the future, models will need continuous improvement to sustain user engagement, meaning investment is unlikely to decline.
His conclusion is that while the ultimate end-state of the software industry is uncertain, the chip industry has already benefited from the AI buildout cycle—and that tailwind should continue. He added that enterprise AI adoption is still early, and more sovereign nations are beginning to increase AI investment. Arya also pointed out that chip-sector valuations already reflect concerns about slowing spend or downward revisions to earnings expectations, but those concerns “may not actually materialize.”
From a trading perspective, this drawdown looks closer to a “narrative-driven correlation shock.” When the market sells software on the thesis that AI will displace it, while simultaneously selling AI chips on the thesis that AI ROI is worsening, core AI assets like Nvidia can easily get dragged down in the process—through position unwinds and broad risk re-rating.
Arya concluded that what Nvidia investors most need in the near term is clarity on whether this price action reflects a real change in AI capex and demand fundamentals, or whether it’s coming from indiscriminate, cross-sector de-risking triggered by the narrative that “AI beats software.”
That was Arya’s interpretation, and I also don’t really understand this selloff.
If I had to find a reason, you could argue that there was simply too much leverage in the system recently, and mechanical selling—like CTA-driven flows—may have contributed.
Still, I think the magnitude of the drop is excessive.
I’m really bummed that I don’t have any cash right now, so I can’t buy more even after this drop.
제 학부 친구 중에 양자컴퓨팅쪽에서 아주 딥하게 일하는 친구가 있습니다.
제가 인정하는 몇 안되는 똑똑이들 중에 한 명인데, 최근에 계속 엑스 눈팅만 하고 있길래 직접 글 써보라고 설득했고 지금은 잘 하고 있네요 ㅋㅋㅋㅋㅋ
(뭔가 사회생활 처음 시작하는 제자 보는 느낌)
이 쪽 분야 관심있으신 분들은 팔로우 부탁드립니다. 이 친구가 꽤나 nerd 라서 물어보는�� 다 대답해줄거에요.
$SPOT.
I like the stock here as SPOT is a part of the “quality growth, off-the-highs” bucket alongside Roblox, DoorDash, Sea Limited, AppLovin, Reddit.
Name is attractive to investors seeking compounders outside the most crowded AI hardware/software debates.
Upgrade Catalyst
1. Pricing → ARPU: GS today assumes ~6% annual price increases, with upside from a potential “Super Fan” tier.
2. Gross margins: Path to steady +80-100 bps per year in consolidated GMs over coming years.
3. AI leverage: View that Spotify is well-positioned to benefit from generative AI adoption (discovery, personalization, creator tools, efficiency).
Buyside Community Focus Pts
- Tone remains net bullish; limited pushback to the upgrade so far… then core questions still unresolved:
Why is the stock at ~$500? What “wall of worry” remains? AI-generated music risk? Sector rotations / multiple de-rating?Flattening operating profit revisions?
Sustainability of pricing power? Product momentum in Ads, podcasts, video?
- What restarts momentum?
Near-term catalysts into earnings (1Q GM progression, pricing flow-through).
- Valuation framing? How to underwrite the GM trajectory and translate that into a durable OP profile.
What the chart suggests…
2026 Operating Profit revisions have stalled while the stock price remains elevated → helps explain the recent sideways action.
Bottom line
1. The fundamental narrative is improving (pricing + margins + AI optionality), and investor sentiment is constructive.
2. The debate has shifted from “is this broken?” to “what unlocks the next leg?”, with margins and pricing execution the key swing factors.
RDIMM spot prices blow past US$2,000, raising odds of 80% Samsung memory hike
Structural imbalances in the memory industry have emerged due to AI data center demand, sending server memory prices sky high and upstream manufacturers to go all out to increase profits. Severe shortages are expected to persist through 2027-2028. As pressure increases due to insufficient inventory, memory prices also continue to rise.
Confirmation elusive of price hike
Spot prices for server-grade 64GB RDIMM modules have surged to US$2,550, rising more than 20% in just the past half month. This suggests that official contract prices could approach a sky-high US$1,000 level, implying a potential quarterly increase of 90-100%. Recently, online reports circulated documents claiming that Samsung Electronics had issued notices of price increases, citing major changes in the global semiconductor market, including supply constraints and sharply rising upstream manufacturing costs.
The reports claimed that, effective immediately, prices for all Samsung memory products would increase by as much as 80%. Samsung Taiwan said it would not comment on market rumors.
While the alleged price hike notice apparently originated from a Samsung distributor, related companies stated that they have not yet received any confirmed price increase notifications and are unable to verify the documents' sources. With Samsung and SK Hynix still having not fully finalized official pricing, the supply chain is anxiously awaiting the outcome.
Even steeper first-quarter increases
Nonetheless, strong price increases in the first quarter are certain. It is estimated that RDIMM module prices could rise by more than 70%. Some module makers also believe that the manufacturers' continued delay in announcing prices indicates that headquarters are still consolidating views on end-market demand. With nearly all manufacturers' 2026 capacity allocations already sold out in advance, first-quarter price increases may well exceed 80%.
Memory supply chain players note that surging demand for AI computing and inference has driven cloud service providers' (CSPs) procurement of DRAM and NAND Flash ever higher. With capacity expansion unable to keep pace, the demand gap is estimated at at least 25–30%. Server memory module pricing has been particularly strong, with the spot market being the most price-sensitive and likely to reflect upstream manufacturers' contract price increases. Using 64GB RDIMM modules as an example, spot prices reached US$1,850 in mid-January, but have since surged to US$2,250, representing a 20% increase within half a month.
To compare, contract prices for 64GB RDIMM modules were around US$450-460 in the fourth quarter of 2025 and were originally expected to rise to US$800-900 in the first quarter. However, as spot prices continue to spike, server memory modules could reach the US$1,000 threshold. Based on this, quarterly price increases could potentially double.
Server storage cost pressures
NAND Flash has also seen severe supply tightness as enterprise server storage capacities expand. There have recently been plans to mobilize hundreds of millions of US dollars to approach US-based NAND supplier SanDisk with prepayment offers for long-term supply contracts. However, contract negotiations have been repeatedly delayed, with pricing and supply volumes still under negotiation. While contract price increases are expected to be more moderate than anticipated, with wafer-level Flash prices rising by around 30–50%, order fulfillment rates remain below 50%.
Memory contract prices will see their most dramatic, step-like increases in the first quarter of 2026. From the second quarter onward, the pace of increases is expected to moderate, but DRAM is still projected to have room for 20-30% price hikes, while solid-state drives (SSDs) are expected to continue seeing increases of 30-50%.
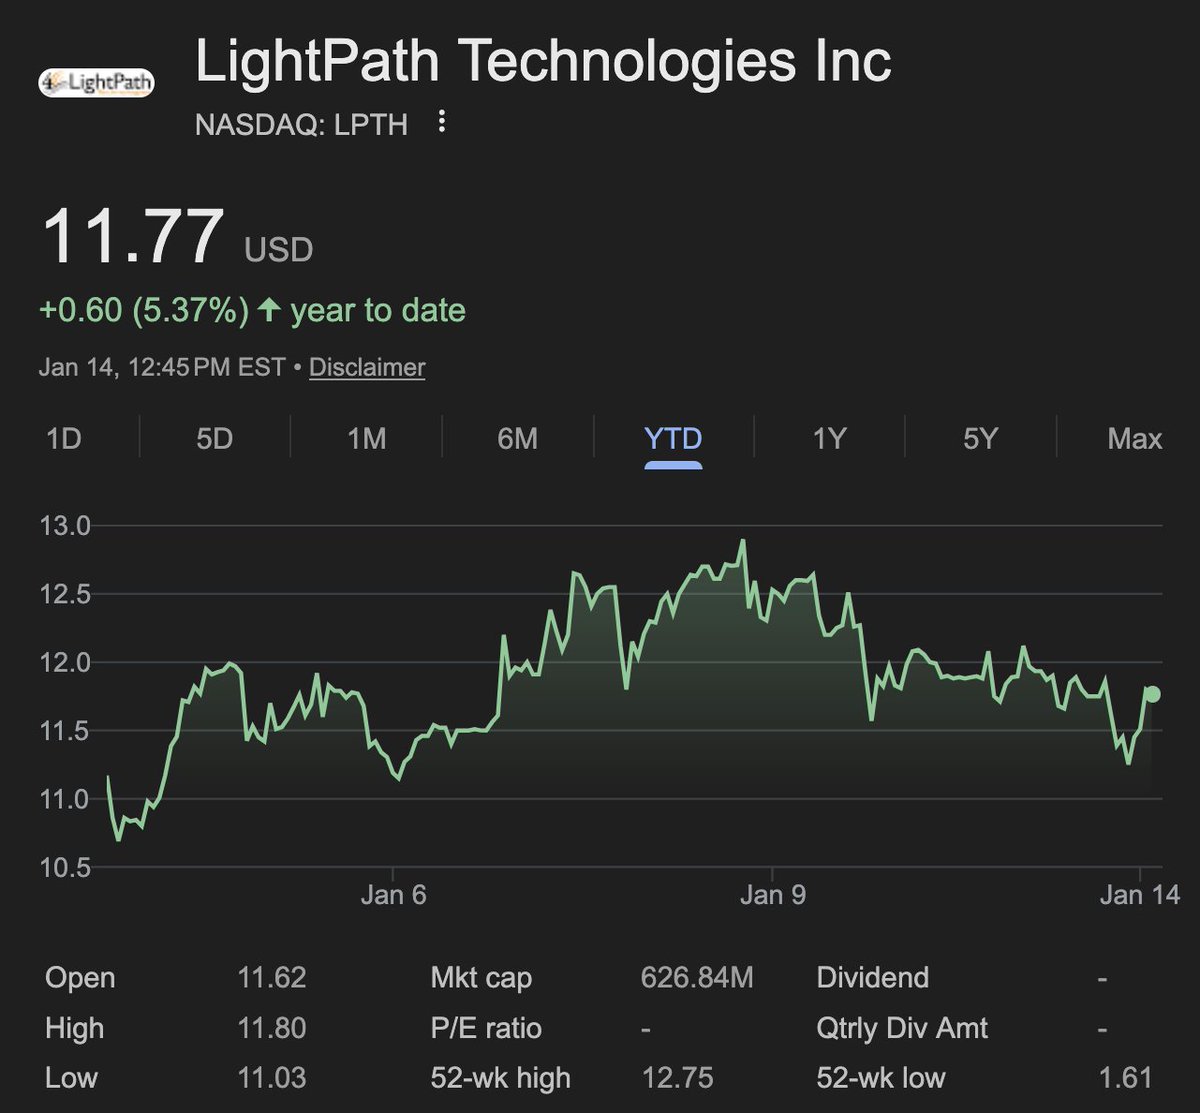
I've initiated positions in $LPTH ($621M).
Lightpath is incredible.
Every modern thermal weapon (Missiles, Drones) requires Germanium glass, which China owns (70%)
LPTH is the only US alternative with: Black Diamond
Users?
- $ONDS
- L3Harris
- Lockheed
- Andruil (likely)
- $UMAC
- RTX/Raytheon or Northrop Grumman for the most recent $18.2M contract.
Ondas: Iron Drone Raider(counter-UAS interceptor drone) and Optimus uses LPTH for Thermal Camera Cores.
L3Harris SPEIR uses Lightpath for Infrared Camera Assemblies on Arleigh Burke-class Destroyers.
Lockheed Martin Stinger Missles and M-SHORAD uses Lightpath for Missile Seeker Optics.
Anduril likely uses Lightpath for The Ghost (Autonomous Drone) for Uncooled LWIR (Long Wave Infrared) Cameras.
Unusual Machines uses Lightpath for Attack Drones (Molded Thermal Lenses).
RTX or Northrop (one of them) uses Lightpath for Advanced Tactical Pods or Next-Gen Missile Seekers suing Infrared Camera Systems.
This literally is the only Western alternative required for modern weaponry and drones.
Lightpath now has an amazing balance sheet:
~$75–80 million in cash (with -$5M debt)
-FY 2025 $37.2 Million. FY 2026 est. ~$61.6 Million
- FY 2025 Gross 27.2%, FY 2026 35-40% by year-end.
- FY 2025 Backlog ~$40 Million. FY 2026 Backlog $90+ Million.
They are sold out. Expanding margins. And majority of the top US defence contractors now use Lightpath as a Western alternative to China's supply chain of Germanium glass.
Absolutely incredible company, I don't say this very often.
So I personally went long on Lightpath as military contractors will rely on them in the future for advanced weapons.