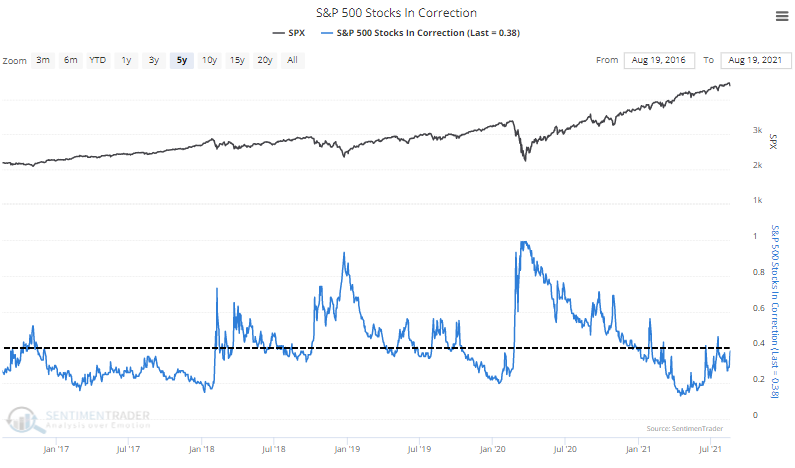
3. Proportion of S&P500 stocks in a "Correction"
"nearly 40% of S&P 500 stocks are more than 10% below their peaks" -- also note the trend there...
h/t @sentimentrader $SPX $SPY
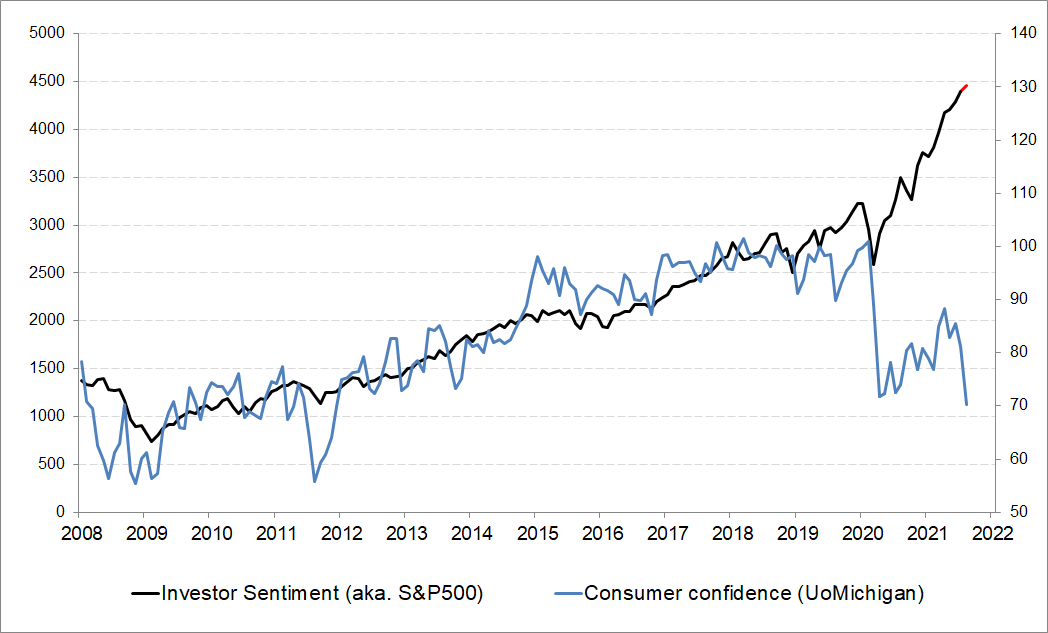
1. Macro Divergence...
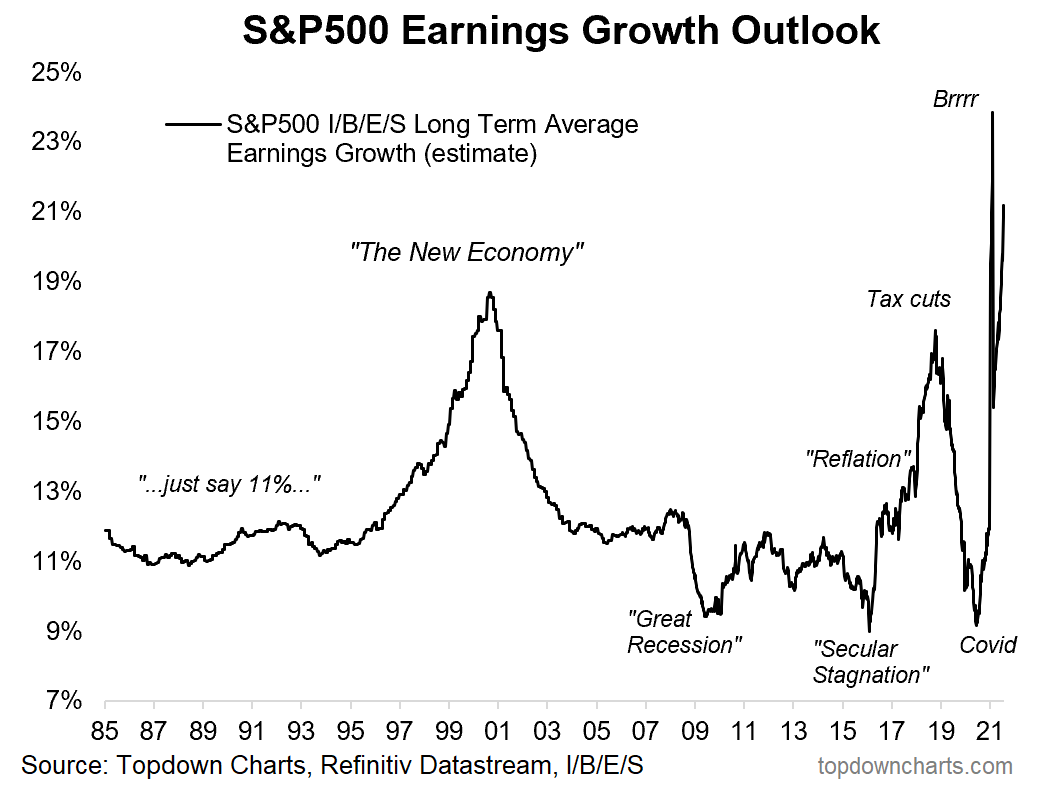
Economists vs Stock Analysts -- data is disappointing economists: are analysts too optimistic on earnings?
@topdowncharts $MACRO $SPX $SPY
$IWM U.S Small Cap Index. Currently forming a classic bearish multi month {H&S} top. Notice the {Double Top} at the $233 level. The setup will trigger short with a breakdown below $209. Notice the $VIX volatility index is again coiling inside a {Triangle} ready to breakout. $TZA
2. TD Ameritrade Investor Movement Index
Ticked down in July from a record high -- we don't like to see these types of indicators do that...
https://t.co/X9ox3LDu2f $SPX $SPY
Dip buyers have been strong but hedging activity has been as well. McElligott of Nomura noted 1m Put SKEW at 98th %tile.
Short-term correl b/w $VIX & VVIX has also turned negative with VVIX moving higher this week.
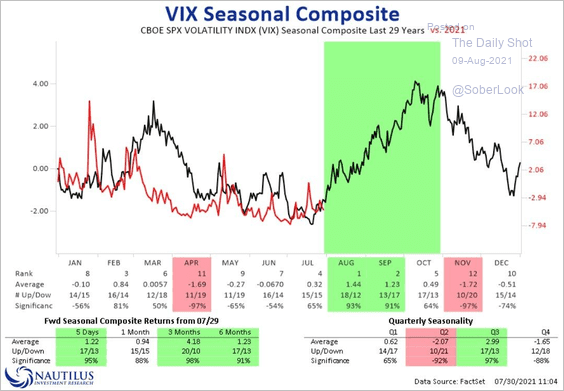
$Vix:$vxv has been sub-80 for a week. This is unusual. The last time was in Feb right into a 4% drop in $SPX. Before that: last Aug before a 10% drop in Sept. Reactions were more muted in 2017, a year quite similar to 2021 in other ways