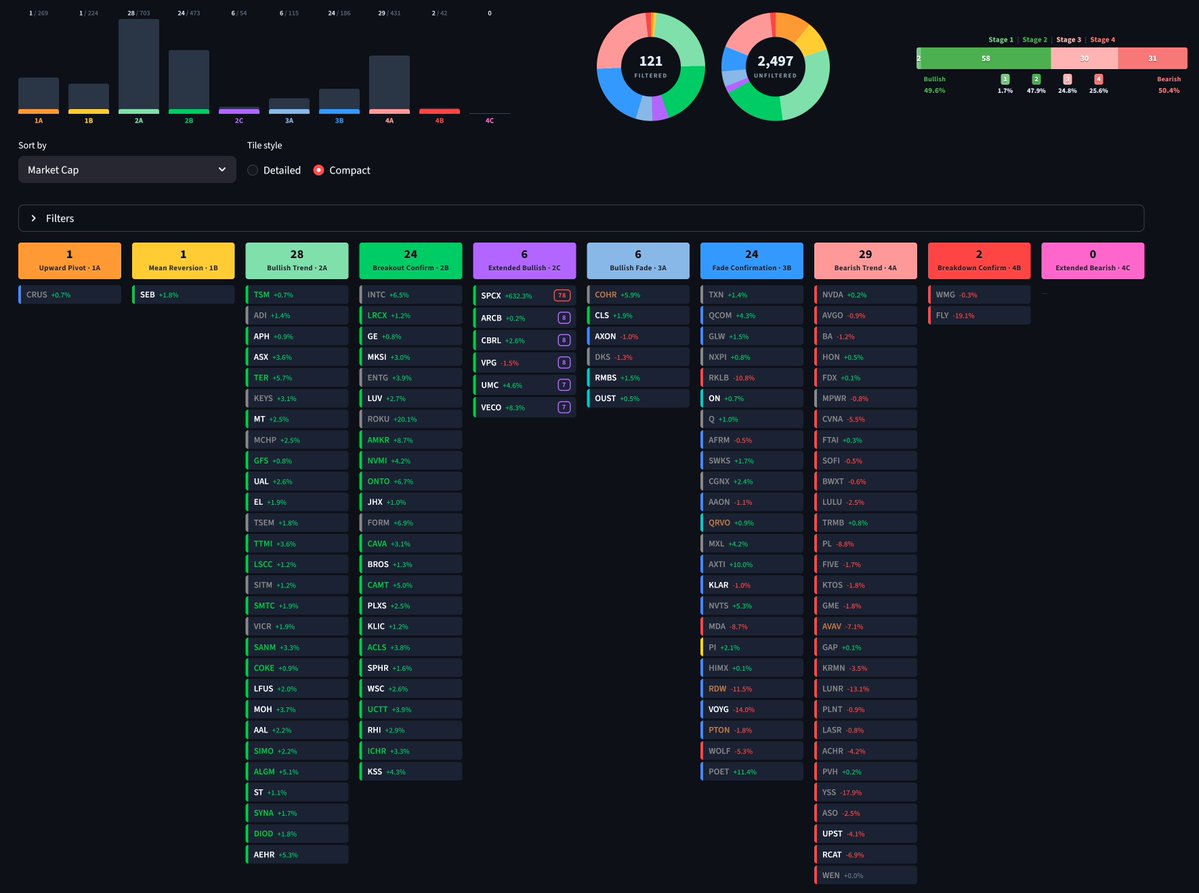
📈Stage Analysis: Leading Stocks in Leading Groups
121 of 2,497 swing trading* stocks are in leading groups
Font colors:
🟠Trend inflection ⬆️
⚪️Trending ↗️
🟢Buyable
🔵Reduce 50% if holding
🍐Restore full position if trimmed
🟣Extended (7x ATR-to-SMA50 or greater)*
🔴Sell 100% if holding
🟤Trend inflection ⬇️
🐘Trending ↘️
This interpretation of Stage Analysis has been adapted to swing trading and is aligned to Oliver Kell's "Cycle of Price Action".
* D$V +$50M with above avg. ATR
The colors on top align to the 10 stages for swing trading (see pic 2) but the tile stripe color and the font color are calculated independently and at a more granular level.
Font colors are "signals" - they are event based and signal to buy/add/reduce/sell, otherwise they inform that a stock is in an up (white) or down (gray) trend.
Tile stripe colors are more nuanced than the 10 "Stage" states. They are very similar to the stage in terms of alignment (you will usually find a ticker has a tile color no more than +/- 1 stage) but they are calculated independently.
For example, orange and yellow stripes indicate "mean reverstion" upward with orange occurring first then yellow.
$GEV (pic 4) was declining i.e. Stage 4B but now is in Stage 1A with orange stripe meaning it is in the early stages of mean reversion. If it continues tomorrow, then the stripe may become yellow.
$WMT (pic 3) is also Stage 1A upward pivot but it has a yellow stripe/candle which means it is further along on the mean reversion (orange occurred earlier).
Net Equity Supply Just Flipped Positive for the First Time in 18 Months.
We estimate a ~$114 Billion Per Quarter Was Holding This Market Up
For most of 2025, corporations bought back more stock than they issued. Not by a little. By a factor of two.
We estimate roughly ~$114 billion per quarter in actual share retirements across approximately 504 companies. That is not authorizations. That is shares permanently removed from the market, verified.
Against that, new equity issuance averaged $55-70 billion per quarter. The math was simple: more shares leaving than entering. Every quarter. For five consecutive quarters.
That is the structural bid no one talks about. It does not depend on sentiment or flows. It shows up every quarter and shrinks the float. It is the reason the market kept going up even when every macro indicator said it should not.
The quarterly net equity supply since Q1 2025:
Q1 2025: -$61.9 billion (buyback dominant)
Q2 2025: -$46.4 billion
Q3 2025: -$60.3 billion
Q4 2025: -$47.9 billion
Q1 2026: -$43.6 billion
Five consecutive quarters of net share reduction. The buyback machine absorbed everything the capital markets created and removed tens of billions more on top.
Then Q2 2026 happened.
Gross equity supply surged to $264.6 billion in a single quarter. Three deals drove it: Alphabet $84.75 billion, SpaceX $75 billion, Super Micro $7 billion. All three raised equity to fund AI infrastructure.
For the first time in 18 months, supply overwhelmed the buyback bid. Net equity supply flipped to +$150 billion. The structural buyer that powered the rally was outmatched.
The question is whether Q2 2026 was an event or a regime change.
If it was an event, the buyback machine reasserts itself in Q3 and the structural bid returns. The three mega-deals were generational, not repeatable.
If it was a regime change, the AI infrastructure buildout creates a sustained wave of equity issuance that permanently shifts the supply-demand balance. If every AI company follows the Alphabet playbook of raising equity at scale to fund capex, the buyback bid is no longer the dominant force.
At 65.7% equity allocation and 44% rate hike probability, the pool of available buyers is already stretched. The market does not need to crash for this to matter. It needs new buyers to replace the structural bid that just disappeared.
The easy part of this rally ended the day the supply wave started.
$SPY $QQQ $SPCX
Trading strategy making you money right now is already dying.
You just can't feel it yet.
Two finance professors tracked 97 published strategies. One year after they went public, the average edge was down 58%.
Every edge has a half-life. Nobody hands you the expiration date.
So three red weeks hit, and you panic-quit a strategy that was still alive. Or you marry a dead one and bleed for six months defending it.
You can't tell the two apart by feel. That's the entire problem.
There's now AI tool that draws the line for you.
Horizon backtests 5 years in seconds and runs thousands of simulated paths, so before you go live you already know how deep and how long a normal drawdown runs.
Drawdown is weather. Decay is information. One you ride out. One you cut.
Then it runs the strategy automated -> the exit gets decided by the math you set when you were calm, not the mood you're in at the bottom.
The same loop a quant desk pays $25,000 a year for. Yours for $0 while the beta open.
Save this -> re-read it the next time you're three red weeks deep and about to fold a strategy that's still alive.
Full framework in the article above.
Free access while the beta's open: https://t.co/qMCIUPVKGK
Before any bears come out
B of A is not assuming $INTC reclaims server CPU dominance. It expects Intel’s server CPU value share to so slightly decline to about 24% by CY2030 from about 41% in CY2025
Yet Intel CPU revenue still grows because the total server CPU TAM expands sharply.
So, the thesis again is not Intel wins share. It is the pie gets so much bigger that Intel can lose share and still grow materially.
Double upgrade is not about more CPUs
It is about Bank of America now values Intel as a fully integrated IDM by CY2030 with EPS power of about $6.24
@Mojo_flyin@SemiAnalysis_ These bozos were writing off intel at 20$, now everyone is behind it.. but the challenge is dcai revenue share is going to be like just 30% by 2030.. intel products need to innovate. Nvidia hasnt committed anything on intel foundry till 2029 at the very leaat.. but yeah 200$
🚨🚨🚨SPY VOLATILITY ALERT | Thursday June 11, 2:00 PM
$734.79. Up 1.29%. Trump called off attacks on Iran. IV just crashed 7 points. The dealer engine re-engaged. Three of four stabilization conditions just confirmed in a single session.
THE RECEIPTS:
June 3 we published: "Iran strikes broke the near-term regime." The selloff began.
June 5 we published: "The selling is mechanical, not structural. The correlation regime is green."
June 9 we published four conditions for stabilization: selling exhausts, GEX moves toward zero, dealer delta flips positive, magnets reappear above.
All week we said: "The structure needs to stabilize before any catalyst can work."
The catalyst just arrived. The same geopolitical risk that started this selloff eight days ago is being de-escalated by the same administration that escalated it.
THE STABILIZATION CHECK:
1. Selling exhausts: +132M shares bullish flow. Was -157M yesterday. A 289M share swing. CONFIRMED.
2. GEX toward zero: -$946M full chain, improved from -$2,021M yesterday. IMPROVING.
3. Dealer delta flips positive: +25.0M. Was -16.5M this morning, -17.0M yesterday. CONFIRMED.
4. Magnets reappear: $750 (+$70M), $755 (+$48M), $800 (+$66M). Three magnets in the top 10. Was zero for three consecutive sessions. CONFIRMED.
Three of four confirmed. GEX still negative but improving. This is the strongest stabilization signal since the selloff began.
THE VANNA MECHANIC IS FIRING:
IV crashed from 25.7% this morning to 18.8%. A 6.9-point compression. The largest single-session IV drop of the cycle. Dealer effective vanna at +137.3K means every point of IV compression forces dealers to buy shares mechanically. 6.9 points of compression on +137K vanna is significant forced buying. This is the exact mechanic we described all week: "When IV compresses, vanna fires, dealers buy."
It's firing right now.
THE NUMBERS:
Composite: +18.5 Neutral. Was -50.1 Strong Bearish this morning. A 69-point improvement. The largest intraday composite swing of the entire cycle.
Flow: +132M shares. The largest bullish session since the June 4 record (+195M). +$1.34B call premium at 72%. The institutions are back.
Premium: +$1.34B call-heavy. Was -$732M put-heavy yesterday. A $2.07B swing. The put regime broke.
Dealer delta: +25.0M. Positive. Short shares. Buying dips mechanically. The engine is re-engaged and pointed in the right direction.
Deep floor: $684. Cushion: 7.0%. Stable through the entire selloff. Never broke. Never got close.
THE GEOPOLITICAL ARC:
June 3: Iran strikes. Selloff begins. GEX inverts.
June 4: Record +195M buying. One-day recovery.
June 5: Record erased. -$1.8B GEX. -161M flow.
June 9: $724.83 low. IV crosses 25%. Record -203M flow.
June 10: CPI cold but market sells off anyway. Mechanics override fundamentals.
June 11: Trump calls off attacks. IV crashes 7 points. Three of four conditions confirm.
Eight trading days. The same catalyst that started the selloff is ending it. The structure tracked the entire arc in real-time.
WHAT STILL NEEDS TO HAPPEN:
GEX needs to move toward zero. At -$946M, the amplification regime persists. The bounce is being amplified upward the same way the selloff was amplified downward. Wider ranges continue. The blanket isn't restored.
The bounce needs to HOLD. Every previous recovery this week (Monday morning, Tuesday morning, Wednesday morning) faded by the afternoon or next session. This is the first one with three of four conditions confirmed. But the pattern of failed bounces is the recent track record. Tomorrow morning is the confirmation.
$742 is the near-term GEX flip from Tuesday. If price reclaims $742, the near-term regime normalizes.
$750 is the first magnet. The same level that was the ATH anchor two weeks ago is now the recovery target.
3 trading days to FOMC. The structure entering Warsh's first meeting just improved dramatically.
$750 is the magnet. $735 is at price. $720 is the floor. $684 is the deep floor. 3 days to FOMC.
$SPY $QQQ $IWM
Neither. But a collapsing stock market (which this is not) on a day inflation actually improved is worse. Core CPI came in below forecast this morning. Inflation is decelerating. The stock market sold off anyway. The price action isn't about the economy right now. It's about the plumbing underneath. The system that usually catches falling prices broke last week and hasn't been repaired yet. Think of it like a building where the sprinklers went offline. The fire isn't bigger. The fire suppression is. That's the gap between what the economy is doing and what the market is doing. They'll reconnect. They usually do.
$SPY $QQQ
The watchlist is live at close.
However everyone should have their own rules for:
i) Entry => Opening Range Break (ORB), break over prior day high, flat base breakout, Undercut & Reclaim of a key moving average etc.
ii) Stop Loss => Low of Day, Prior Day Low, Cost - 2xATR, failure at a key moving average
iii) Position sizing => fixed % or $ of portfolio, driven by ATR and % of fund risk (i.e. risk 0.25% of the portfolio)