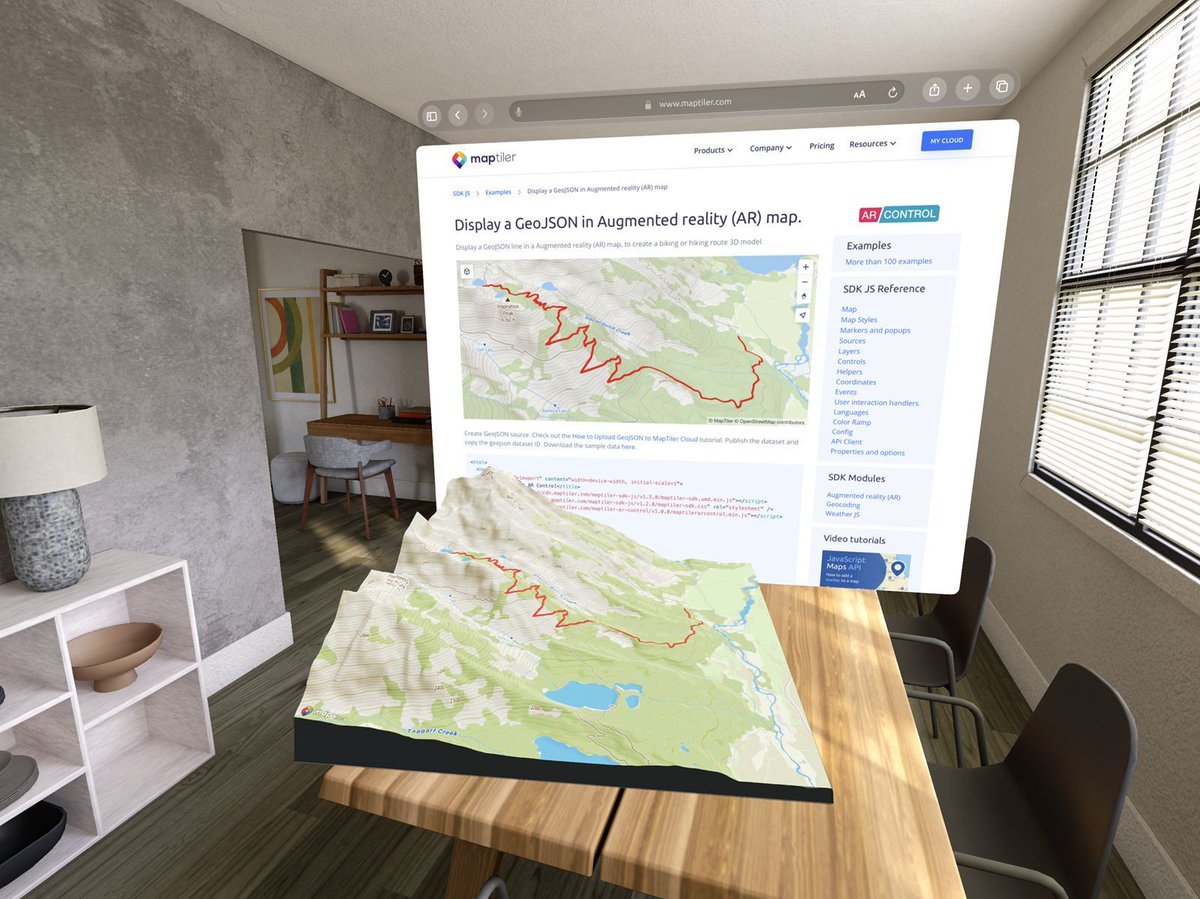
Emersing your users in a 3D world is easy with MapTiler. Add an Augmented Reality button to your #JavaScript map with two lines of code; no need to deploy anything to an app store! More details: https://t.co/ZNi04suvMz
#SpatialComputing#AR#MR#AugmentedReality#MixedReality
@SatelliteSci@argoproj@awscloud Congratulations, looks like a great output! Awesome to see the resource usage graphs as well. Just shows how much goes into making these products
@AndrewF11526574 @kennethfield Just goes to show peach and pink is the pinnacle of cartographic styling. You’ll have to update my marks in EVB203 to reflect that!
Introducing our new Mapbox Standard style, with 3D urban environments, dynamic lighting, landmark 3D buildings, and an elegant symbolic aesthetic.
📣 Learn more in our announcement post: https://t.co/t51LKITWvk
#mapdesign#mapping#gischat
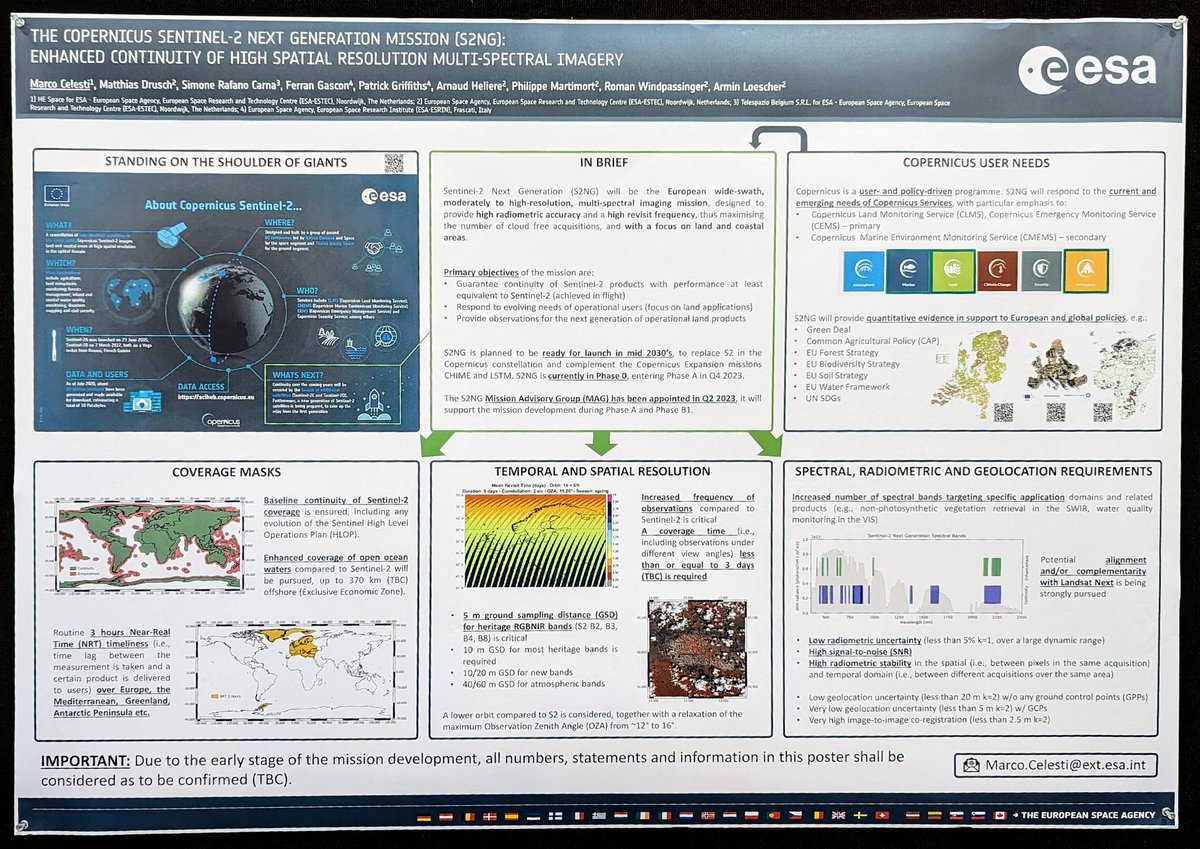
One of the most exciting #IGARSS2023 posters: an early glimpse at @CopernicusEU's Sentinel-2 Next Generation Mission (#S2NG)!
Some possible improvements:
🔍5 m res RGB/NIR bands!
🌈New visible + SWIR bands to align with #LandsatNext
🌊Expanded ocean coverage
📅Mid 2030s launch
A huge thanks to everyone from the Victorian Coastal Monitoring Program for collecting and sharing their amazing #citizenscience#UAV coastal monitoring data to help us validate #DEACoastlines - such an incredible resource! 🚁🌊
@AndrewF11526574 @undertheraedar Really interesting blog post. The use of minimum bounding circles to assist in validation is an interesting method. I have a feeling the Australian version might be a touch longer!
@umbraspace@SkyfiApp@dominocielo Easily the two companies I���m most excited for this year. Can’t wait to get my hands on some high resolution imagery!
ARIA displacement maps from Copernicus Sentinel-1 radar acquired 8 Feb. 2023. Along-track shows displacement in north-northwest direction, and cross-track shows displacement in line-of-sight to radar (mostly west). Western end of M7.5 rupture and SW end of M7.8 ruptures covered
📊 Australian Individual Tree Biomass Library
This dataset is a compilation of biomass sampling of 15,054 individual measurements of 274 tree & shrub species across 826 sites in Australia, from 94 studies between 1950-2015.
🔗 https://t.co/zYkTFX0mwO
#NCRISimpact#databyte#tree
👇Using the {lidR} package to both create a DEM as well as extract tree canopies, and then plotting the data (using the new `render_tree()` function) in 3D with #rayshader + #rayrender: the reason #RStats is so awesome is you have tools to do everything!