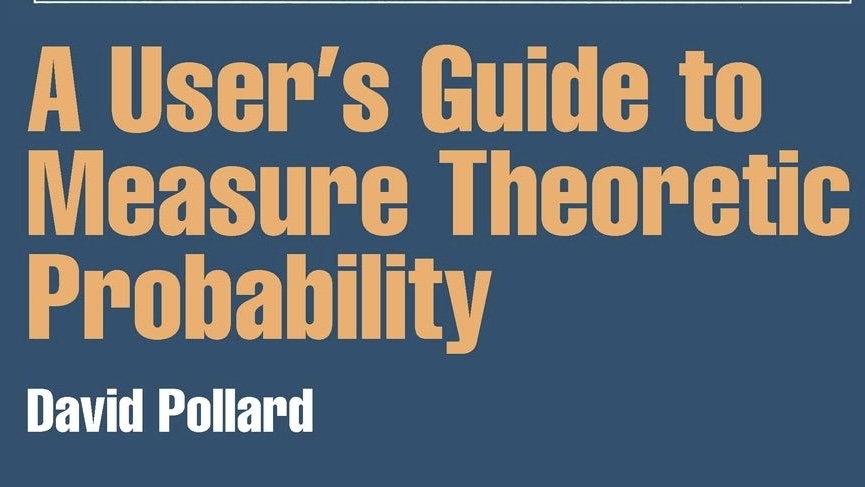
Should data scientists and applied statisticians put in the huge amount of effort needed to learn measure theory?
After years of searching, I finally found the answer in this book. Read on if you're curious.
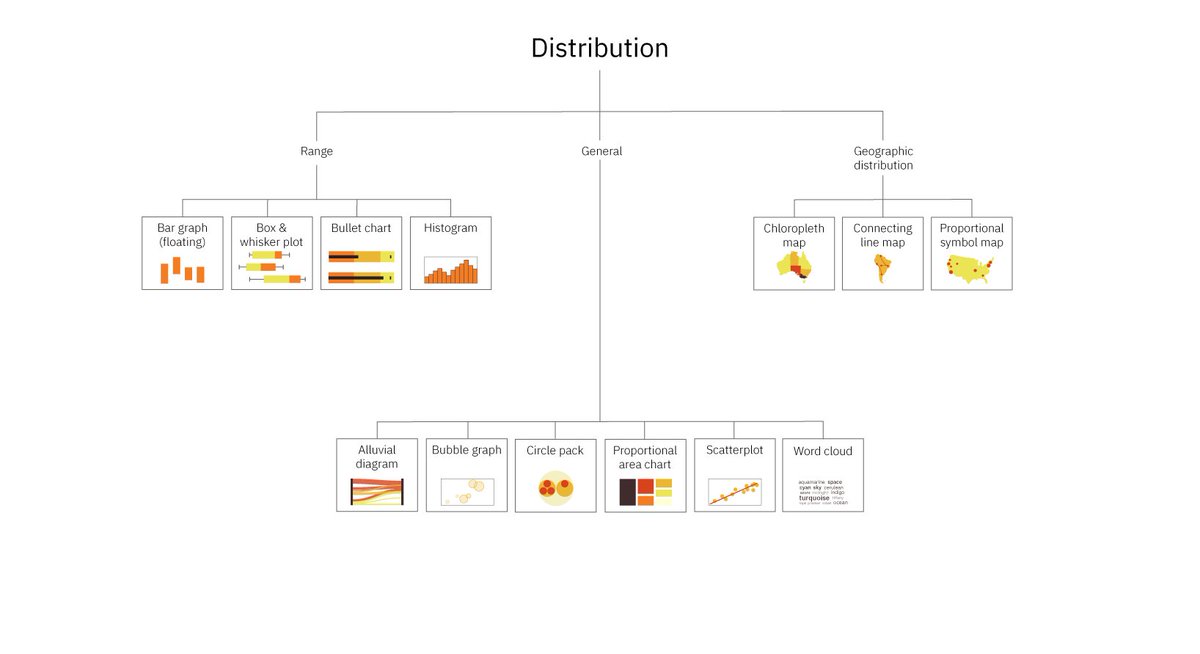
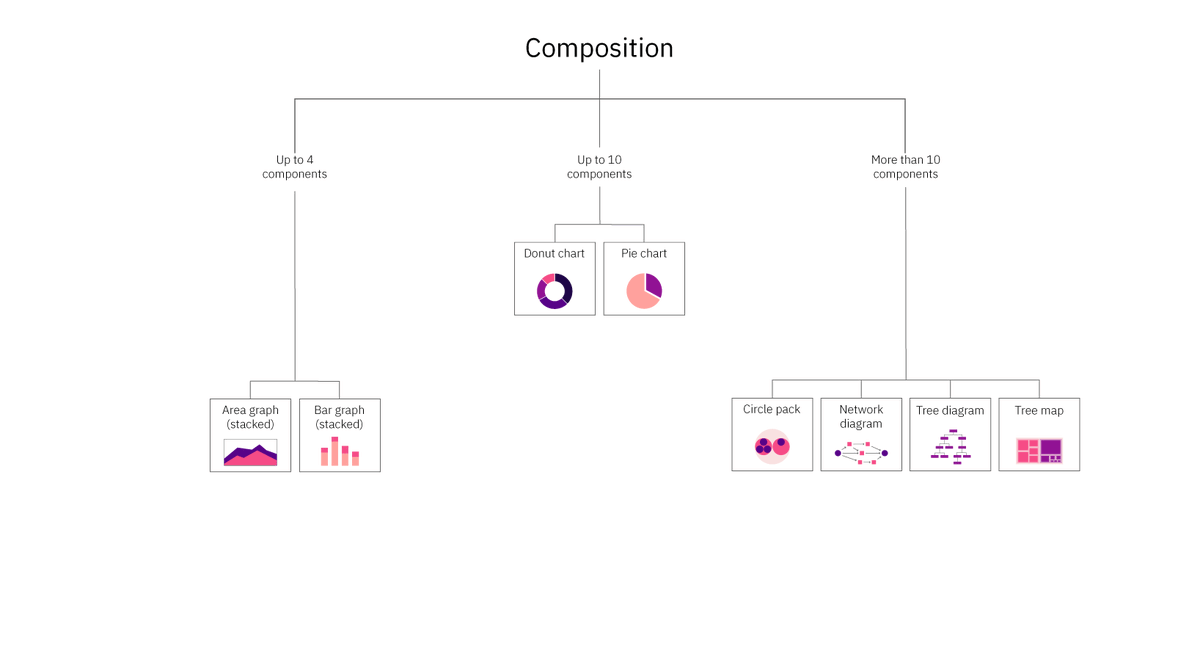
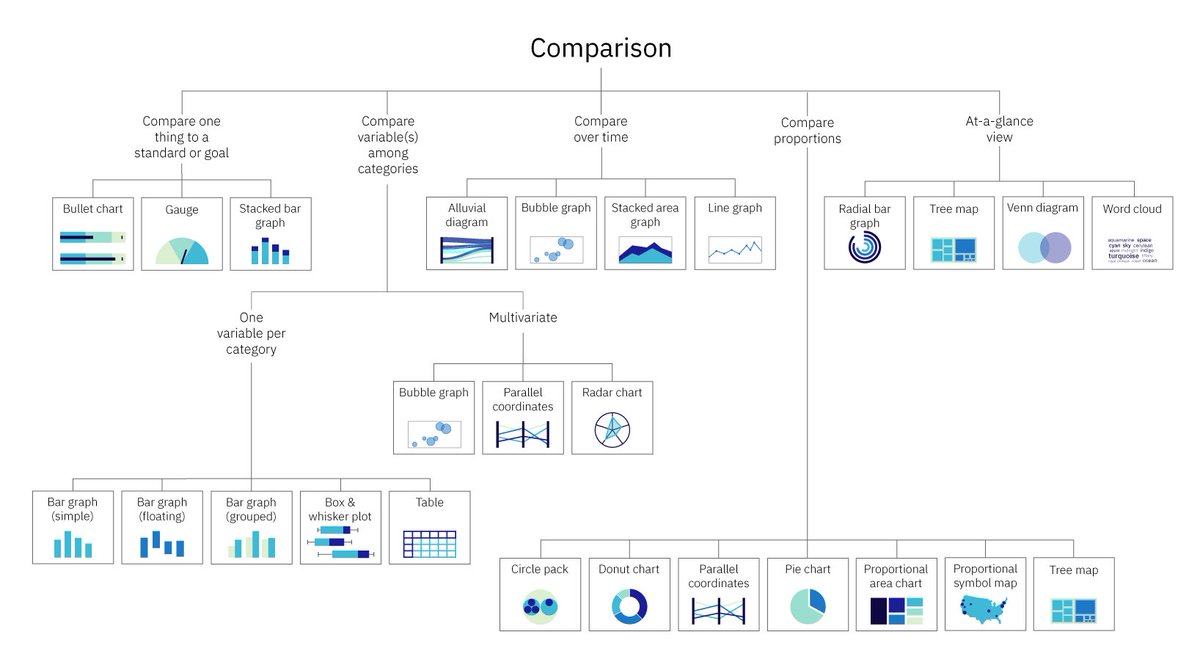
Getting Data Visualization Right (hints and guide)
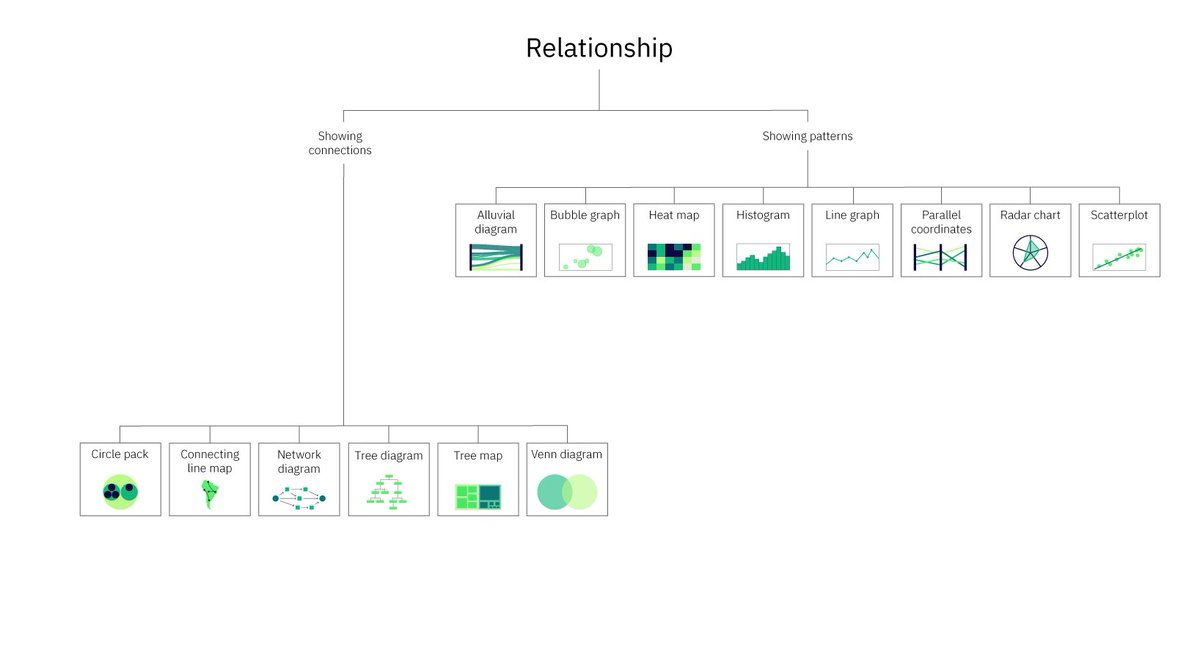
How to choose just the right type of data visualization for comparison, composition, distribution and relationship.
https://t.co/hlxD1wmT85
Many people struggle to understand #Bayesian updating! So I made this super cool #Python@matplotlib#educational, interactive dashboard.
Given a positive test, '+', what is the probability that the an 'Event' is happening? Change the probability of the event, P(Event), true positive, P(+|Event), and false positive, P(-|Event), conditional probabilities, then watch the change in the posterior, P(Event|+)!
I also added P(Not Event|+), P(Event|-) & P(Not Event|-).
Try it out on https://t.co/e1JuUwgDbg ∀.
My 22-year old coaching client landed a new-grad Machine Learning job at a NYC startup that pays $175k per year 🎉
($120k base, $40k stock, $15k annual bonus)
Here's the 17 interview questions they were asked:
(how many of these could you answer?)
We can’t overstate how important DATA VISUALIZATION and STORYTELLING is to data analysis and business intelligence 😊.
So here are the best 8 pdfs on DATA VIZ. n STORYTELLING.
https://t.co/5jotGBgGXW
Kindly retweet and follow me for more.
Check ⬇️for extra 😉
Correct answer: c) Regularize the model with penalties to prevent overfitting. It constrains complexity, promoting better generalization. Avoids reliance on specific examples, leading to robust predictions.
How can we prevent overfitting in machine learning models and ensure generalization?
a) Increase model complexity
b) Decrease training dataset size
c) Regularize the model with penalties
d) Remove outliers from training data
#MachineLearning#Overfitting#Generalization
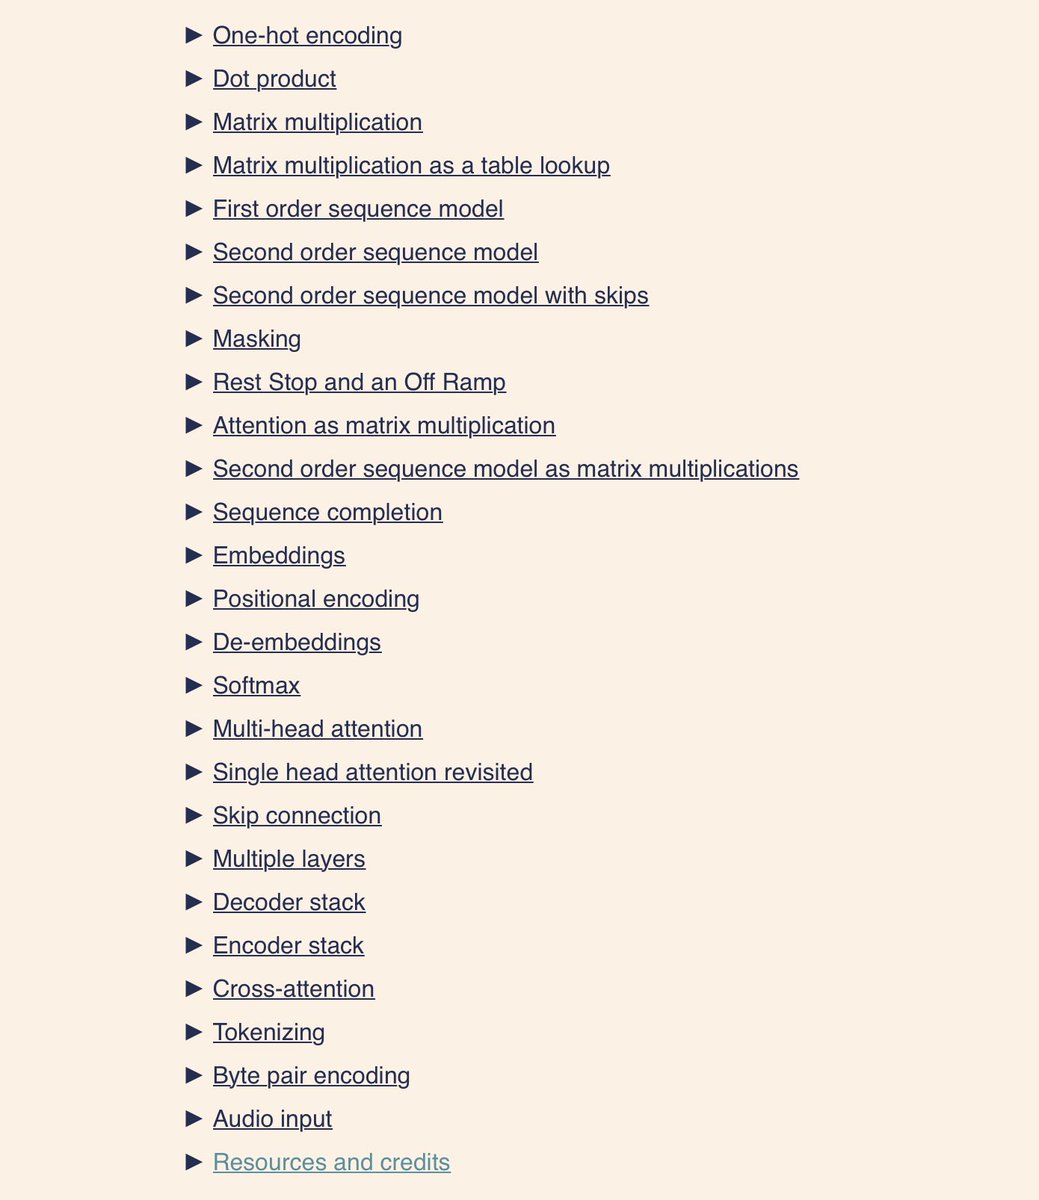
“Transformers from scratch” by Brandon Rohrer 🤖
This is one of the best write ups, that starts from 0 and explains every single detail of the model architecture.
Even if you need a refresher or don’t, I would still highly recommend reading it:
https://t.co/D25bs6TP5X
The best tutorials on building LLM powered applications 📚
@GregKamradt is an incredible teacher of @langchain:
✅ Top down & applied series
✅ Amazing teaching style
✅ Very practical examples
https://t.co/5mMrkswmSf
Next week I’ll be releasing an open source repo that shows you how to build an AI coding agent.
It will be relatively basic, but I’ll continue to add “levels” that add features and complexity.
The goal is to teach people how to build GPT-4 agents for coding & other tasks.
Where do circles, ellipses, hyperbolas, and parabolas like to hang out in the summer? Coney Island!
You can make many different shapes by pointing a light cone onto a flat surface. They might look different but have many common properties. Learn more at https://t.co/zGPijgDfnx
Statistics is one of the most important skills for a Data Scientist
But understanding the concepts, especially the practical use cases is really difficult.
Here is the best way to learn statistics for data science with use cases in an interactive way: 🧵���