The size and make-up of a country’s prison population often reflects its approach to crime and punishment, the state of its criminal justice system, and broader socio-economic conditions.
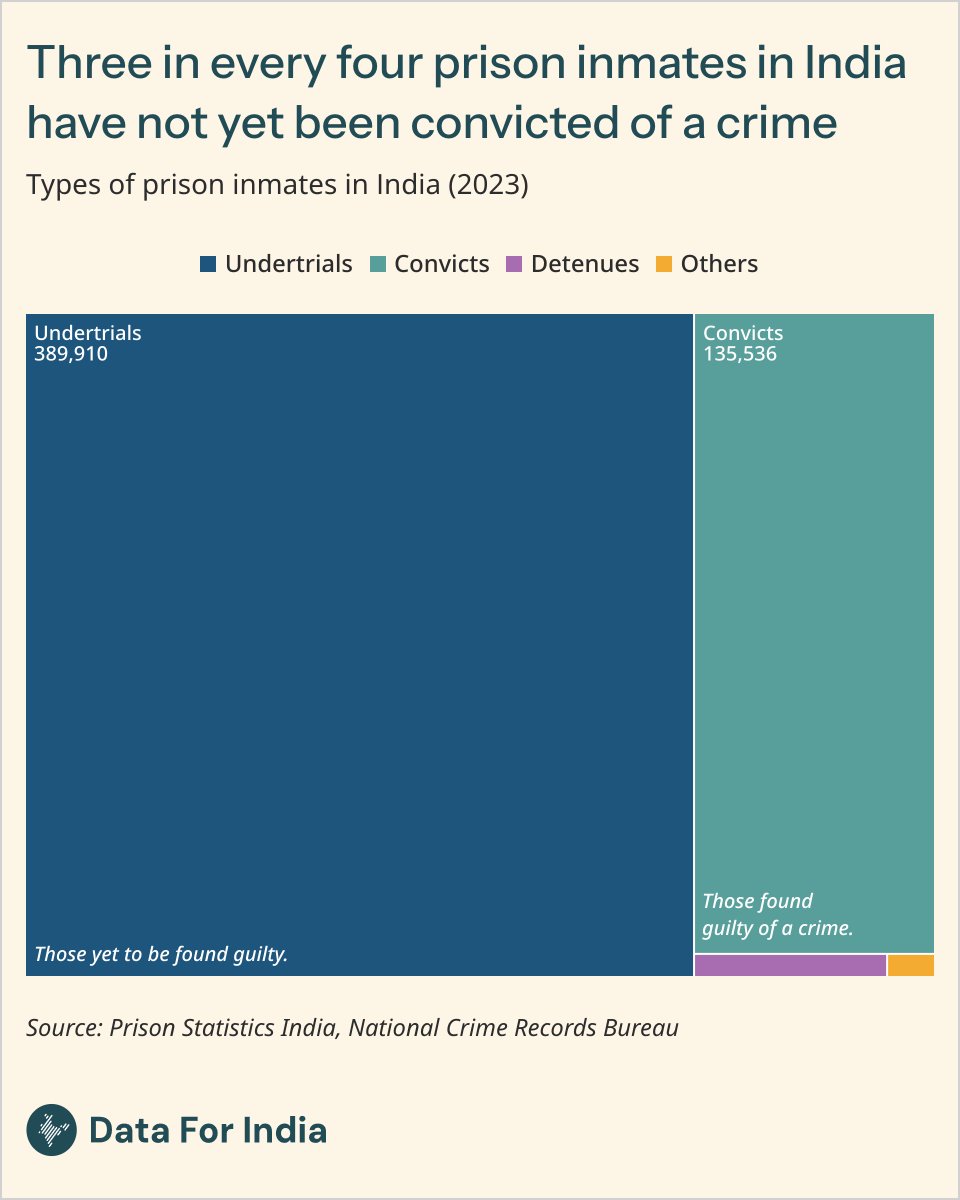
India had over 530,000 incarcerated people at the end of 2023, the fourth-highest prison population in the world. Data on India’s prisons and prison population comes from the National Crime Records Bureau’s (NCRB) Annual Prison Statistics report.
Prison inmates in India are classified into four categories. Convicts are people who have been found guilty of a crime and sentenced to imprisonment. Undertrials are those whose trials are still ongoing and who have not yet been found guilty. Detenues are people detained to prevent them from committing a crime. The fourth category, others, includes inmates who do not fall into the first three groups.
The vast majority of prison inmates in India have not been convicted of any crime. Three out of four inmates are undertrials, with convicts making up most of the rest. Offences such as murder, attempt to murder, rape and those under drug laws are the ones that send most people to prisons, whether as convicts or undertrials.
#Law #Prisons #Crime #India #DataForIndia
New on @dataforin: our legal researcher and writer Ameya Bokil looks at judicial pendency in India - how many cases are pending, at what levels, since when, at what stage, in which state - and why https://t.co/arS9B9NjVO
"The crucial thing to understand about populism ... is that it is a revolt directed against cognitive elites, not economic elites."
Cognitive elites have been struggling against understanding this for a decade. I expect the struggle to cotinue.
https://t.co/ba0FSyYB3E
One of the most effective ways to understand how Indians live is by looking at how much money they spend in a month, and on which commodities.
An average Indian’s Monthly Per Capita Consumption Expenditure (MPCE) on everything except investments is a little under ₹5,000 or USD 60, according to the 2023 Household Consumption Expenditure Survey.
Food occupies less than half of this monthly expenditure, both in rural and urban India. This share has seen a steep fall over the last few decades. In the 1960s, 80% of the rural household budget and nearly 70% of the urban household budget, was on food alone. The decline in monthly spending on food mirrors global trends, where growth in incomes and a move away from manual labour leads to a relatively lower share of the household budget being devoted to food.
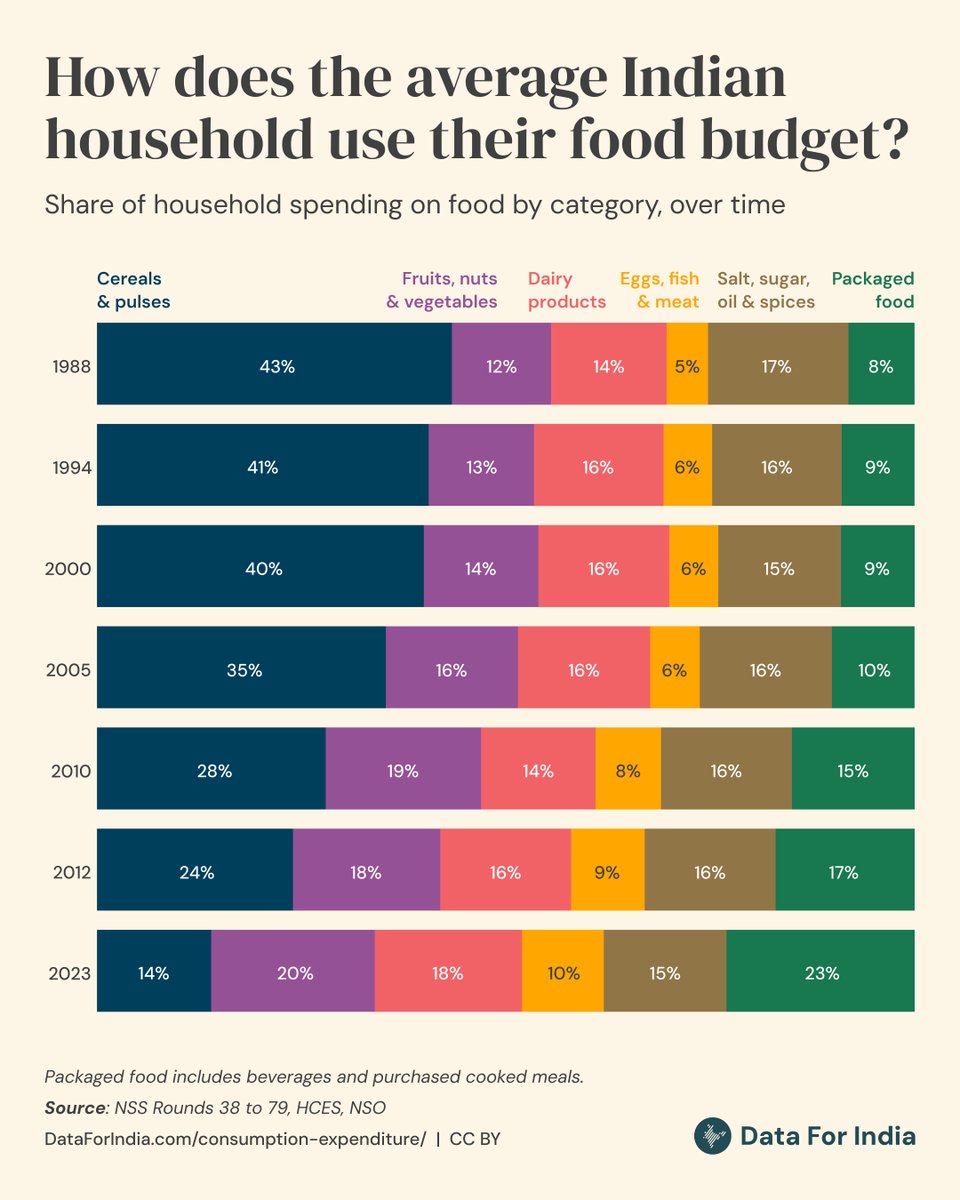
This shift in monthly expenditure on food is driven by a big decline in relative spending on cereals. On the other hand, fruits, eggs, fish and meat have seen their share in food expenditure rise over the last few decades.
One of the most significant changes in Indian spending has been on processed foods, which include packaged food, beverages and purchased cooked meals. Their share in the monthly per capita consumption expenditure has nearly doubled in the last two decades.
How much money do Indians spend across these different food categories? Read @akwaghmare's piece to find out: https://t.co/yBSuDRe1SH
#ConsumptionExpenditure #HouseholdSpending #LivingStandards #India #DataForIndia
AI, ORALITY, AND THE GOLDEN AGE OF GRIFT
In today's newsletter, I go back to Ong-posting to try to answer the question of why grift is so out in the open these days. Why don't people feel shame and the impulse to obfuscate? Why don't other people react more judgmentally?
"The world is better understood as misaligned incentives rather than coordinated oppression"
What if this was the core thing we taught in Intro Econ instead of how to calculate the stupid deadweight loss triangles
Really great eval
LLMs are already great at next token prediction in the training corpus, so the test for truth-seeking is now whether they can answer correctly when the correct next token is at odds with the next token in the most similar example in the training corpus.
In complex, modern societies, ignorance and misperceptions are unsurprising. The puzzle - the fact that demands a deep explanation - is that some people hold accurate beliefs. Some thoughts: https://t.co/wyiWm4eRn9
How many factories does India have, and how many persons do they employ?
The 20mn factory jobs are just 4% of India's workforce.
Read our recent piece on factories and subscribe to our newsletter at https://t.co/tZyk2Mr6tx
Most of the increase in natural disasters in the late 20th century is due to improved reporting—
Tracking the occurrence of natural disasters can save lives by helping countries prepare for future ones.
In our work on natural disasters, we visualize data from EM-DAT, the most comprehensive international disaster database. Make a chart of the number of recorded disaster events over time — like the one here — and it looks like the number of disasters rose alarmingly from the 1970s to the millennium. This has led to many media outlets and organizations claiming that the number of disasters has quadrupled over the last 50 years.
However, as EM-DAT itself makes clear, most of this is due to improvements in recording. The Centre for Research on the Epidemiology of Disasters, which builds this database, was not established until 1973, and didn’t start publishing EM-DAT until 1988.
The number of recorded disasters increased due to more focused efforts to obtain globally comprehensive data and improvements in communication technologies, which allowed more events to be included, even in the planet's most remote areas.
EM-DAT suggests that only data from 2000 onwards is relatively complete and comparable. The number of events before 2000 is likely to be underestimated. Note that this data does not tell us anything about the intensity of disasters.
(This Data Insight was written by Hannah Ritchie.)
New from me: Hegel and the AI Mind
This is the first in a 2-part series mapping Hegel's system to modern concepts in computer science and machine learning.
And India managed to reduce malaria deaths without a sizable increase in randomly distributing malaria bed nets. Just through good old fashioned economic growth.
Historically, when countries moved away from an agrarian economy, economic growth first came from industry, followed by a much later growth in services. This was true for the early industrialisers of Europe and North America, as well as Japan and some other East Asian economies.
For India though, the move to services came much earlier.
Industry in India is composed chiefly of manufacturing and construction, with mining and utilities being smaller components. The share of industry in the economy grew only slightly from 23% in 1973 to 28% in 2023.
Additionally the share of manufacturing in India's GDP, historically the largest component of industry, declined from 1960 to 2023, having hit its peak in the 1990s. This is substantially different from the trajectory of South Korea or Bangladesh, where manufacturing continues to drive growth.
The limited growth within industry in India did not come from manufacturing, but from construction. Read @akwaghmare’s piece to learn more about India’s unique move away from agriculture: https://t.co/HYikE0jpom
#Agriculture #Industry #Manufacturing #Economy #India #DataForIndia
Our paper on ingroup bias in the Indian judiciary — we didn't find any — is finally out!
This paper has one of the two best graphs I've ever made — on publication bias in the judicial bias literature.
Black circles are prior studies on ingroup bias. Explanation in 🧵👇🏻
What does the total fertility rate mean?
It's a common misconception to think the TFR is a prediction of the average number of children women will have over their lifetimes. But it's not. 🧵