Transforming complex data into public-facing portals is now a breeze with Akuko. Our no-code platform empowers UN agencies, universities, and research organizations to quickly and effortlessly build interactive data portals.
#datavisualization#mapping#dataviz#datastorytelling
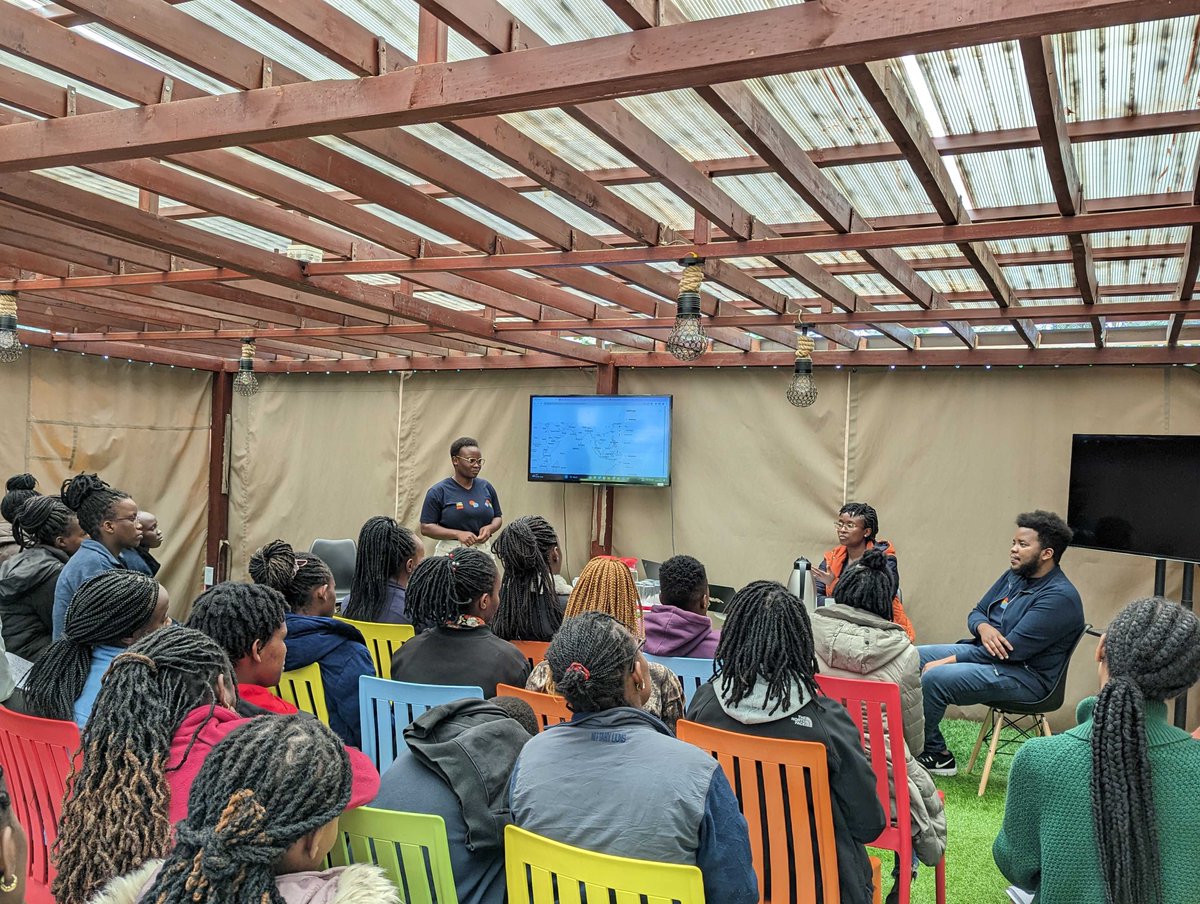
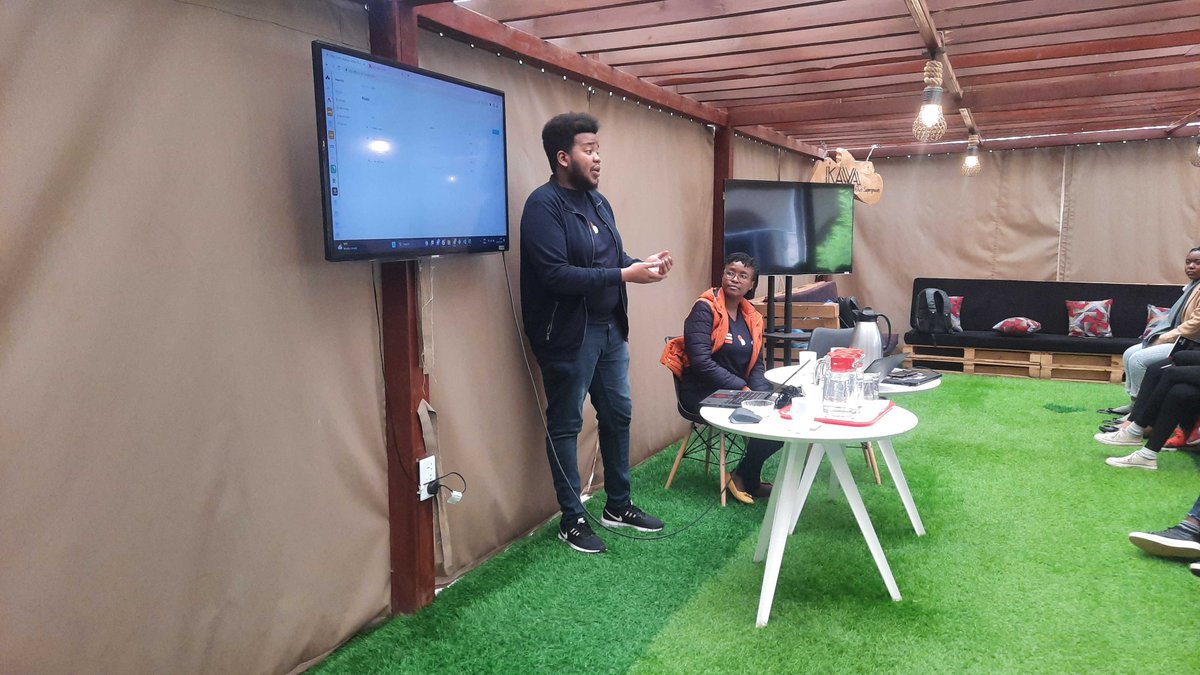
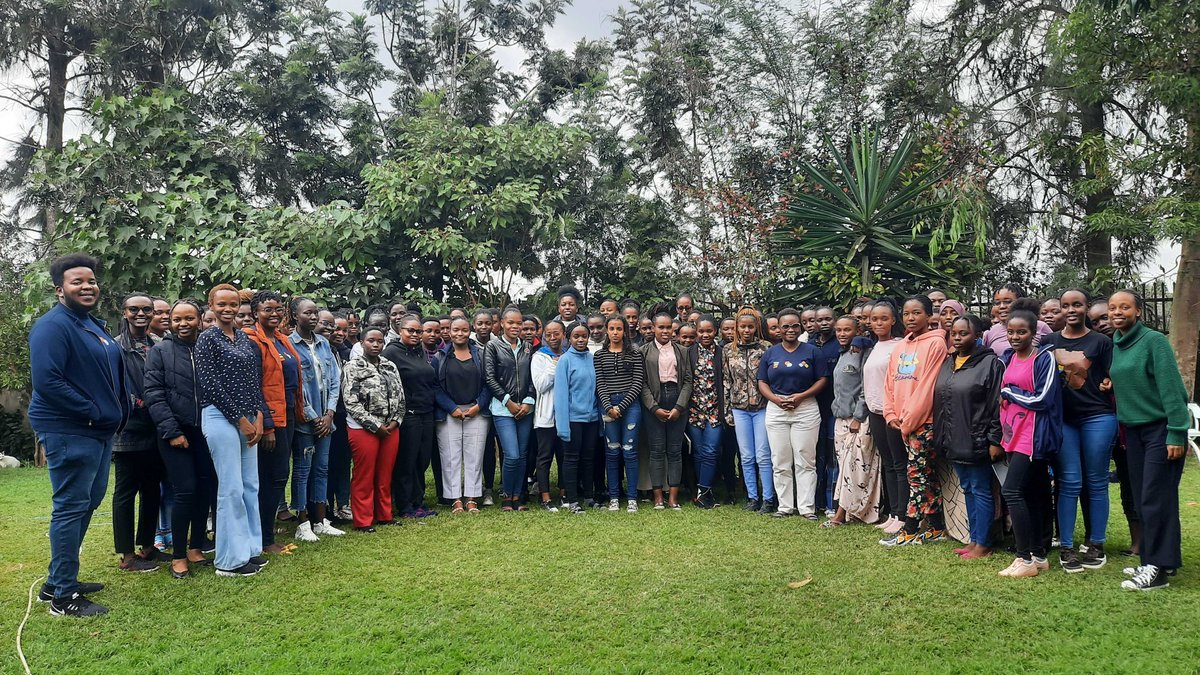
We had an incredible opportunity to visit @akirachix, and all-female tech accelerator firm based in Nairobi, to talk about our data analytics work and @akukoio. Awesome to meet this group of dynamic and talented women.
Want to tell a story using data? You can now try Akuko today. Sign up for our public beta at https://t.co/7M4wb0jrjJ #datavis#DataScience#DataAnalytics#dataStory https://t.co/sgX0glBMm9
Intoducing Map Tours to Akuku! Quickly create engaging story maps no coding required. Signup for a free beta account to try it out yourself https://t.co/N8czWBdJQi
Global Power Plants data explorer containing 36,000 power plants including their capacity and fuel type. Data from @WorldResources built with @akukoio
https://t.co/uAggvQgSUQ
#dataviz#energy
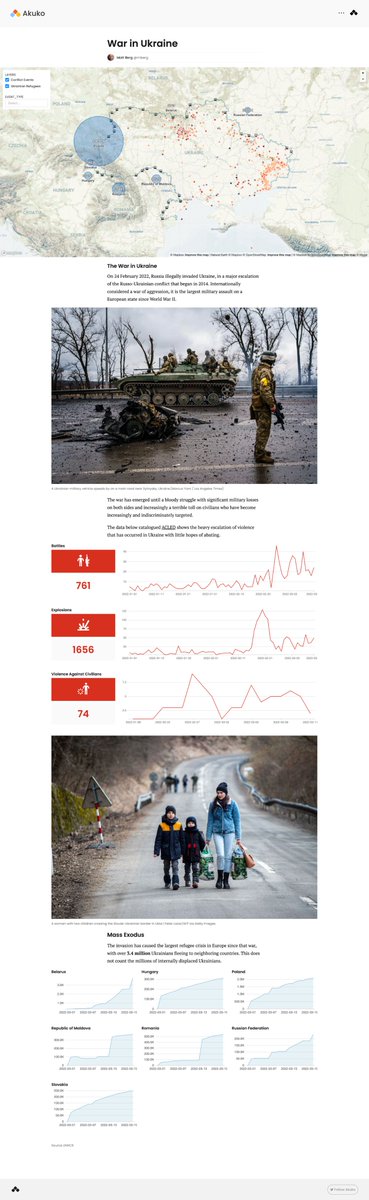
New proof of concept data story on the war in Ukraine using @akukoio. Exciting what it increasingly enables with no code. https://t.co/UJbny1BVr1 #UkraineRussianWar
#30DayMapChallenge Day 17 Land: Land is one factor that contributes to the complex issue of food security. Map showing the near term food security status in Africa as monitored by @usaid's @FEWSNET https://t.co/3lLWzRA2KZ
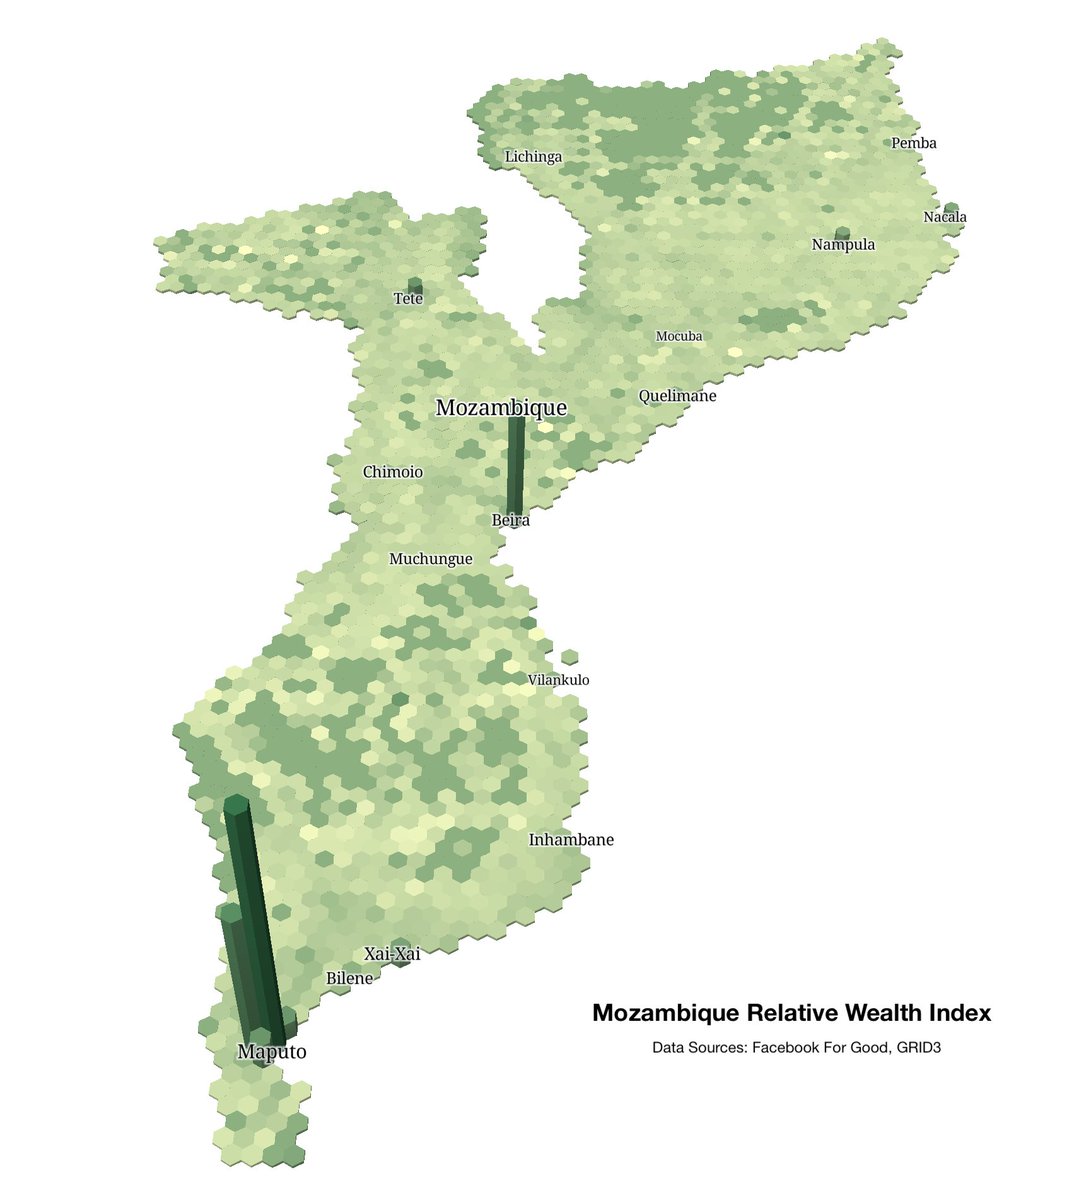
#30DayMapChallenge Day 16: Urban/Rural - Mozambique relative wealth index compared to population. Data sources: @facebook For Good and @grid3global https://t.co/ro2hrbocMd