@grok this was translated for me by Wispr flow as
“to get this message that at csc a car crashed, a man in a car. what was also shocking for me was the first thing i thought was hopefully it’s not a canaco, hopefully it’s a christian white person but it wasn’t. then there’s intersectionality again. we don’t all fight the same fights but we are there for each other in moments like these. thank you. “
What is a ‘canaco’?
People keep confusing a bubble with “stocks go up and get overvalued”. A bubble is when when a prevailing trend and a prevailing misconception about that trend interact reflexively, each reinforcing the other until the gap between perception and reality becomes unsustainable.
A bubble is not when everyone realizes that right now every iota of AI demand eventually, at some point upstream, must move through memory OEMs. Nor is it when estimates continue rising because things are better than expected. And it’s not just when stocks trade expensive to historical valuations.
The reason behind the moves in the AI infrastructure layer so far have been simply that we don’t have enough. They’ve been driven by the fundamental reality more than the perception of the future. It’s why the bulk of the most bullish parts of this cycle have been lumpy and centered around earnings season when companies uniformly come out and confirm there’s still not enough. In the bubble, the reality is driven by the market - not the other way around.
Everyone keeps saying “people are gonna freak out if it’s not a bubble!”. I think that’s silly, we have a transformative new technology that needs crazy capital to fuel it coming to fruition, that has and always will result in a bubble as long as we have financial markets.
But if you want to call the top in a bubble, you need a much stronger view on what the misconception is and what negative catalyst forces broad perception to align with realizing it than you do on valuation.
@WeTheBrandon Where can I read an account of this? The only place I’ve read about is a Michael Hudson book, but I want to know some other sources to look into
Look guys, it's actually really straightforward, a bunch of people staked their ETH on the Ethereum blockchain to earn yield, except they didn't want their capital to be locked up, so they actually staked with a liquid staking protocol called Lido who provided them a liquid staking receipt token called stETH, except they decided to juice their yield further by depositing their stETH receipt tokens into a restaking protocol called Eigenlayer, except they didn't want to lock up their capital, so they actually restaked with a liquid restaking protocol called KelpDAO who provided them with a liquid restaking receipt token called rsETH, except they decided to juice their yield further by depositing their rsETH tokens into a lending protocol called Aave so that they could open a leveraged looping position that borrows ETH against the rsETH collateral and restakes the ETH into rsETH which is then deposited as collateral, except it turns out rsETH used a cross-chain bridge called LayerZero that was hacked by north koreans causing rsETH to become undercollateralized and now these looping positions are stuck and unprofitable, and everyone is pointing fingers at each other, and also DeFi is a very serious industry
I think this is a useful teaching moment, so I’ll try to expand on it a bit.
Over the last few weeks, I’ve heard a lot of statements like “most participants are short,” “everyone is hedged,” and “the pain trade is up.” But when you hear things like that, you really have to step back and ask: who exactly is doing what, and what evidence do I actually have to support it?
At a high level, markets can be broken down into a few key groups of participants:
Large tactical end users;
These are primarily hedge funds and active managers. They are trading to generate returns, and their flows are large, fast-moving, and opportunistic. Like the hedge funds listed in the original post below.
Small tactical end users;
This includes smaller RIAs and retail traders. The flows are smaller, but still active and reactive, often moving quickly in and out of positions.
Large passive end users;
These are large RIAs, retirement programs, insurance-linked mandates, and ETF issuers. They represent massive pools of capital, but their activity is slower and typically rules-based.
Small passive end users;
Your typical buy-and-hold retail accounts. Smaller in size individually, but collectively meaningful. Their behavior is generally steady and long-term oriented.
Non-tactical end users;
Sovereign wealth funds and very slow-moving pension or retirement programs that require 5 year long approval cycles. These are enormous in size but extremely slow to adjust positioning.
Now, if you think about how markets actually move, most short-term price action is driven by large and small tactical players, along with large passive flows. That is where the velocity comes from.
So if “everyone is short” and “the pain trade is up,” you have to reconcile that with reality. If that were true, why did so many of those players (like the hedge funds in the original post) lose money during a market decline? Why did large RIAs wealth programs lose money? Why did a broad set of passive products also take losses?
Once you look at actual performance across the street, the list of possible explanations narrows quickly.
Are pensions broadly positioned for equities to fall? No.
Are sovereign wealth funds leaning short equities? Also no.
Are buy-and-hold retail investors positioned for downside? Definitely not.
What people usually mean when they say “the pain trade” is that large and small tactical players are positioned in a way that would lose money if a certain outcome occurs. But when data objectively shows us the opposite, we have to accept that information.
It might sound elegant to frame things as some kind of 4D chess, but in reality, markets are often much simpler. Most of the time, when it comes to U.S. equities and larger drawdowns, the real pain trade is lower. It continues to seem like that is the case at this moment.
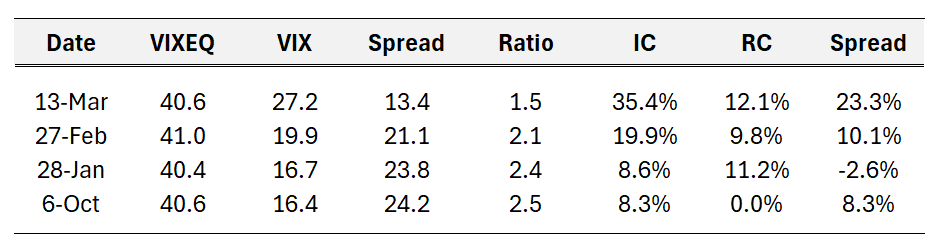
This is a fascinating time to study market prices. The table below shows the "single stock VIX" (VIXEQ) at Friday's close and 3 other times when it was at roughly the same level. The spread and ratio of the VIXEQ to the VIX are very related to the level of implied correlation.
Implied correlation is the single risk factor I've spent the most time on over the past two years. Just like implied vol, implied correlation is driven by carry. That is, its spread to realized. When realized vol goes down, so does implied vol. That's because the economics of the hedge portfolio for an option deteriorate when realized vol falls.
Implied correlation also falls when realized correlation falls. The last several years the SPX has experienced realized dispersion (low correlation) to an extent nearly unimaginable just a few years earlier. The dampening of vol at the index level has been wonderful, but potentially leading investors to underestimate how much risk there was in the index. I've argued that never seen before levels of realized correlation have been a risk hiding in plain sight.
What we see now is a repricing of the relationship between single stock vol and index vol. The numbers below tell the story. The VIX is 10(!) points higher for the same level of single stock vol. If you had the dispersion trade on (and depending how you had it structured), that could be a pretty significant neg mark to market.
Here's what's worth appreciating. The final column is realized correlation. It's up, but not by a great deal. Essentially, the market has simply bid up index vol relative to SS vol because it's willing to pay more for future correlation. That's the spread in the last two columns - the CMP "Co-movement Premium".
Again, to recap, the market has moved the VIX up by 10 without moving single stock vol at all. It's demand for index vol driven by a bid for correlation. If you are in the trade where you are effectively short correlation and you are watching the world of risk unfold, risk management is job#1 and that's about reducing sizing and seeing where the market will ultimately reprice to.
What makes the repricing thus far so worthy of thinking about is that it has not been driven by a surge in realized correlation (ala the Tariff Tantrum of 2025). It's all risk premium and specifically correlation risk premium.
One of the best reads on the Iran conflict I've seen.
My partner Alex (@MacroOps) spent decades in military intelligence before founding Macro Ops.
He's leveraged his network to deliver differentiated insights and provide "the best seat" out there.
https://t.co/6GDaej1Oyy
@boneGPT I was looking for a way to bet on Iran strikes on Kalshi, all I saw was Khameini out by this or that date, Iran closes straight of Hormuz yes or no…I was disappointed.
Funny post tho