A Clear View of Global Shipping Traffic!
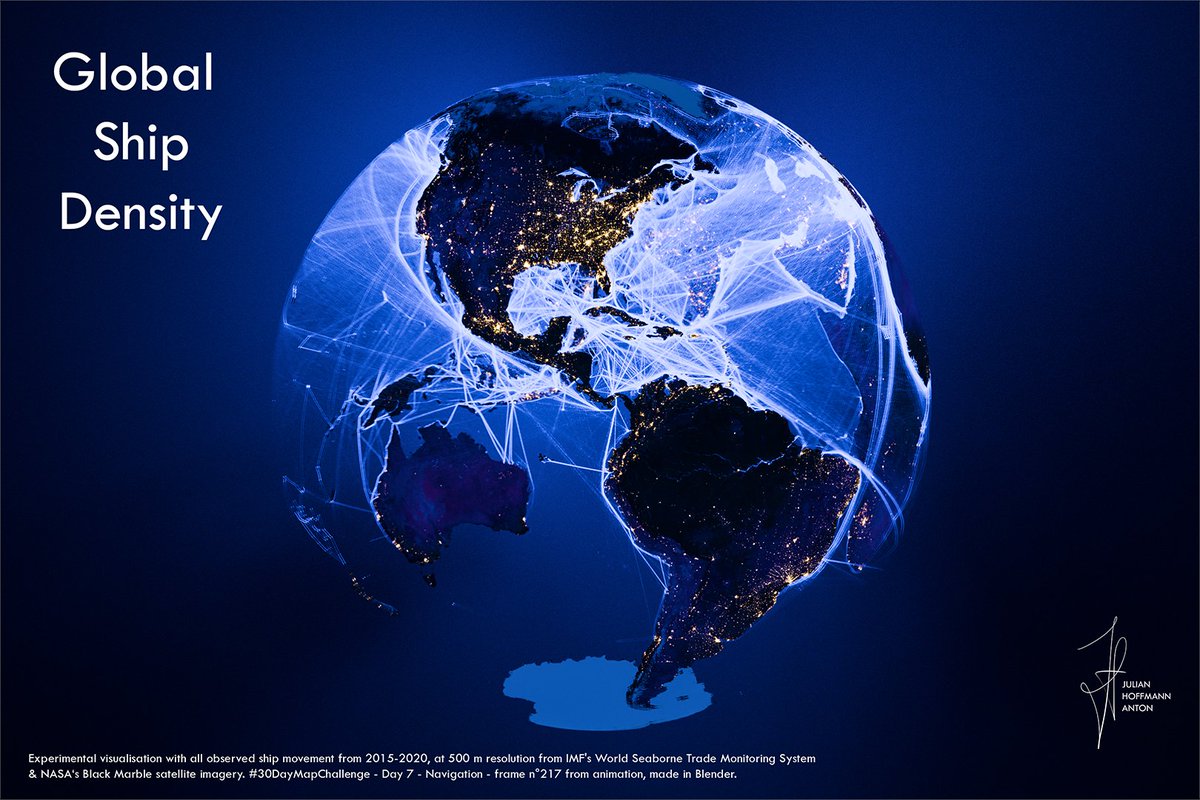
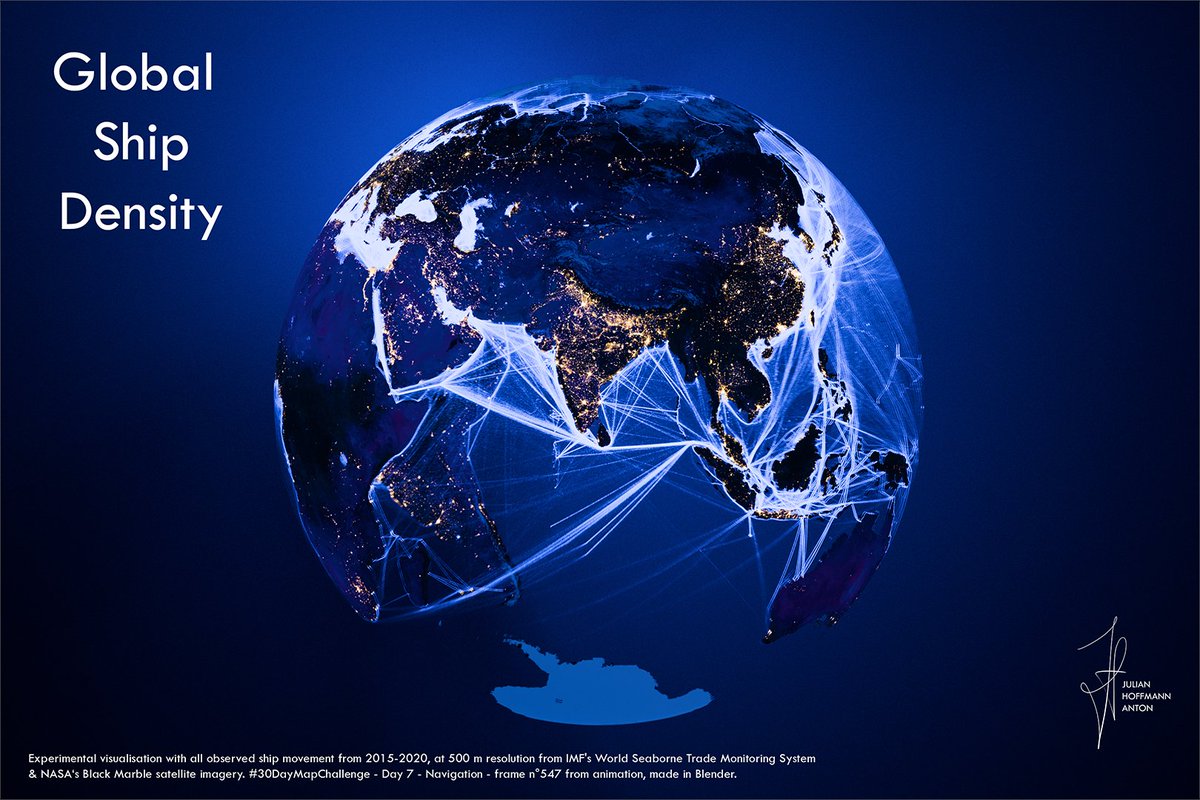
I visualised the global shipping traffic density in an experimental animation with all observed ship movement from 2015-2020, at 500m resolution from IMF's World Seaborne Trade Monitoring System & also NASA‘s Black Marble satellite imagery. The oceans and seas are transparent, creating a unique view that includes the other side of the globe. #b3d #gis #dataviz
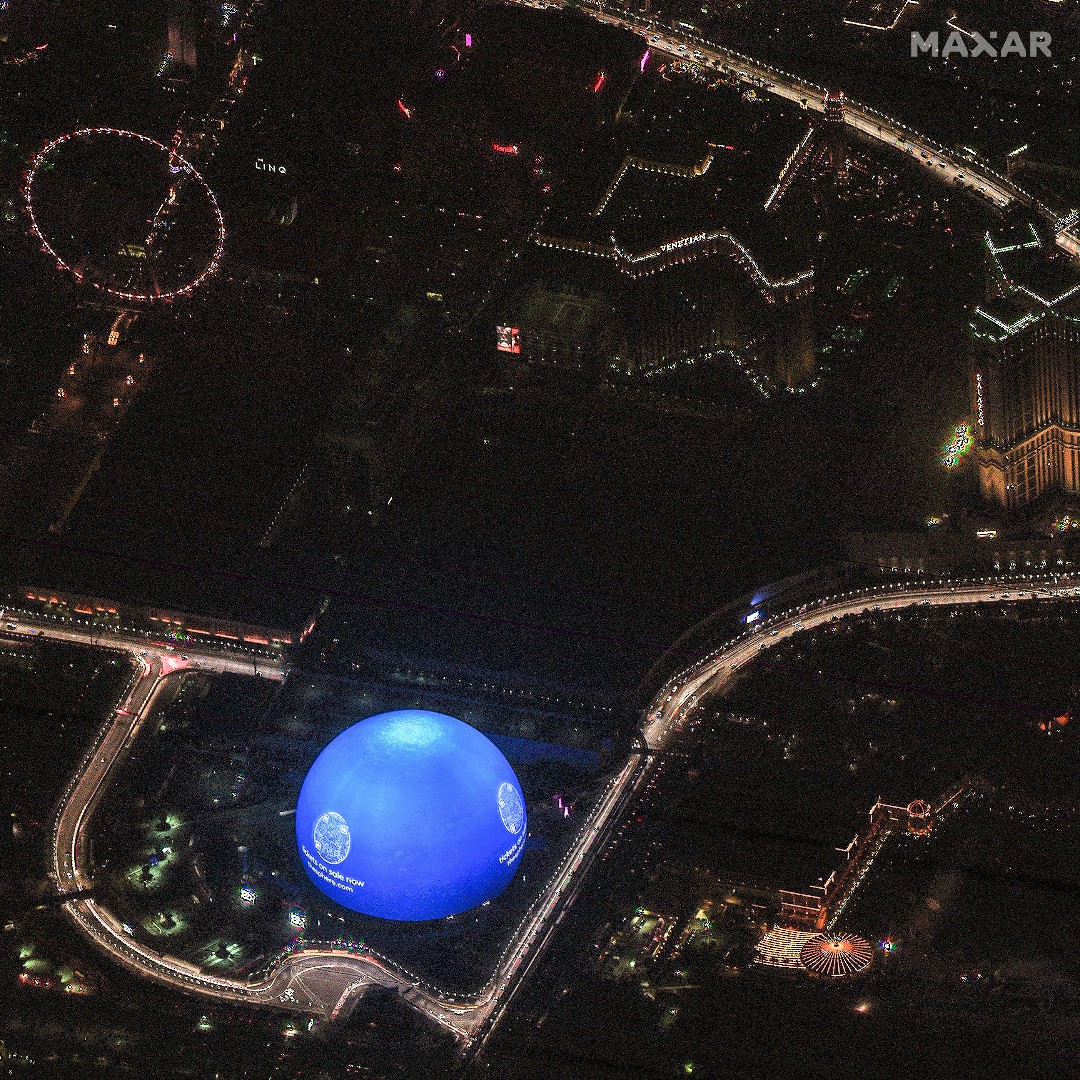
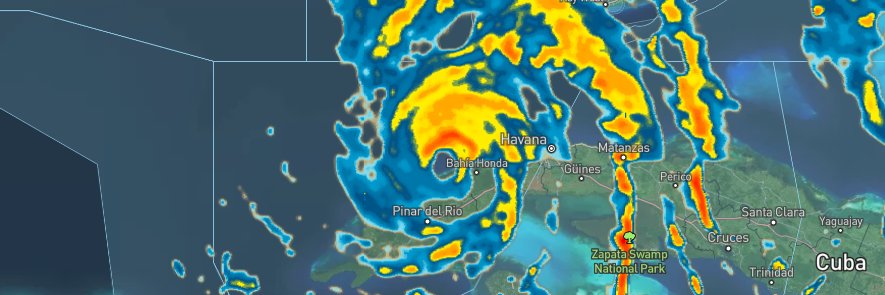
As we approach the end of the year, we collected high-resolution #satellite images that highlight 2023 events as seen from space. Here’s a select few from geopolitical, weather and climate, and human interest events. See the full gallery: https://t.co/t9ZmWJJmgO #viewfromspace
I've been completely obsessed with the GEOS-FP relative humidity data for a while. For day 17 - Flow of the #30DayMapChallenge I decided to embrace the vibes and watch the planet breathe. #maps#gis#blender3D
Some weekend R&D in visualising some of the census 21 travel to work flow data per MSOA. Each sphere is proportional to volume/10. I like using particle flows in these cases to comprehend flow directionality. #map#3d#animation
Global Ship Density - #30DayMapChallenge - Day 7 - Navigation - Which angle do you prefer? Frames from animation made in Blender. Experimental visualisation with all observed ship movement from 2015-2020, at 500 m resolution from IMF's World Seaborne Trade Monitoring System & NASA‘s Black Marble satellite imagery. #dataviz #b3d #shipping
I just released a new version of the #rstats package {mapboxapi}, which helps you use @Mapbox web services in your data science projects.
Haven't used the package before? Let's take a tour!
A 🧵:
The Pacific Northwest and far NorCal are on track to see a significant atmospheric river dropping widespread rainfall amounts of 1-4 inches early next week.
This will likely bring fire season-ending rainfall from Eureka northward and likely put an end to the wildfires, sending smoke south into the Bay Area and Sacramento.
A bomb cyclone will help drive this Category 4 atmospheric river into the region but will remain well offshore, producing wind gusts up to 80 mph and waves up to 50 feet.
This Category 4 atmospheric river, despite its high moisture content, will deliver only modest rainfall amounts due to its fast speed. This is likely a good thing, given the many fresh burn scars in the region.
Connect with the Mapbox team to talk location intelligence + telecom at Mobile World Congress next week.
👉 Book a meeting time here: https://t.co/ZqgJb6ywMO
#MWC23#telco#telecommunications
We're thrilled to announce the successful completion of our Series E funding round with an additional $280 million investment from SoftBank. With this funding, we're expanding investment into AI and 3D - more news coming soon! 🚀
Read our announcement: https://t.co/MnrQgCSH9K
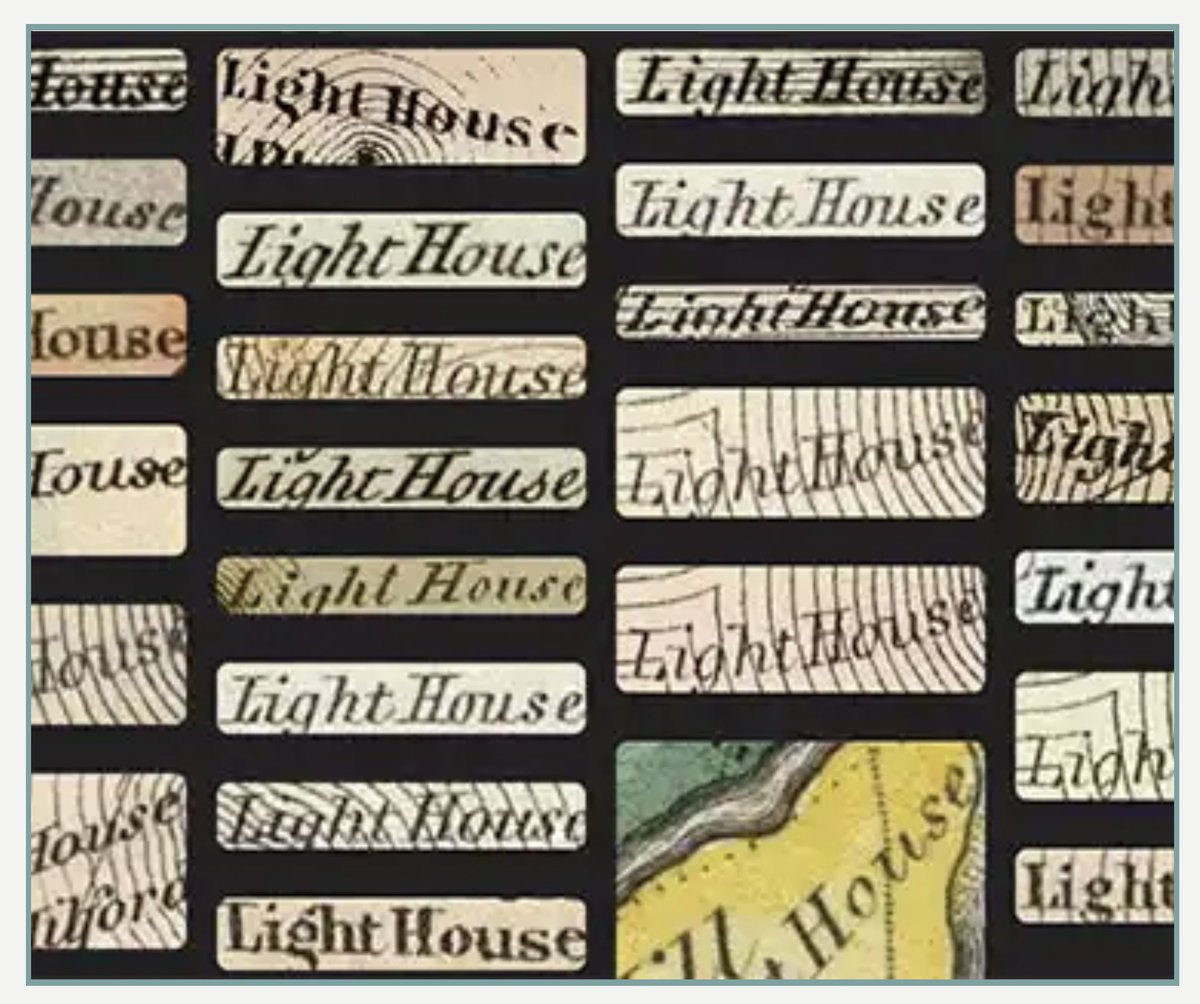
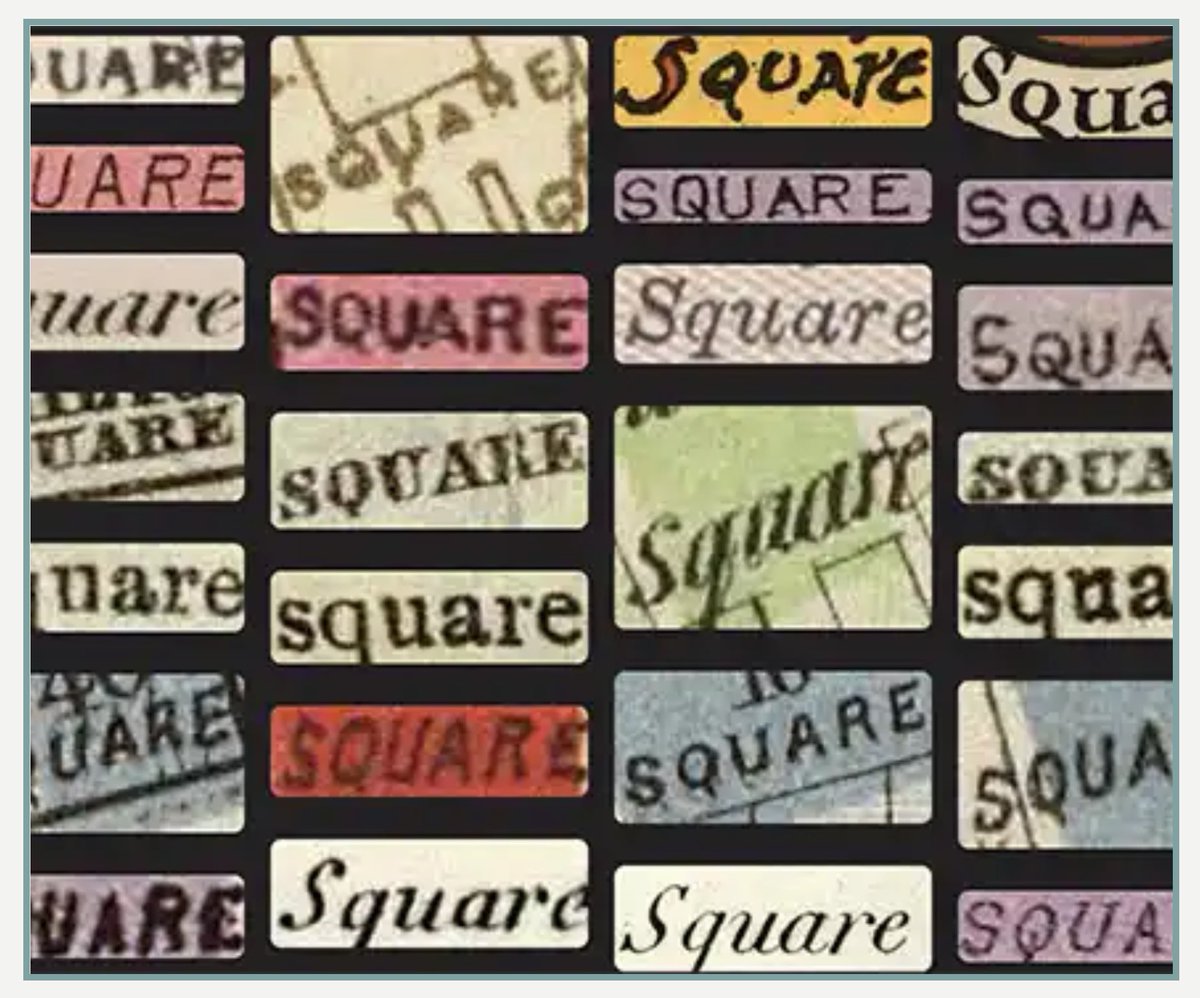
Our new Machines Reading Maps tool that allows searching Text on Maps is now live at https://t.co/I78lXjjztf 100 million words indexed on 57,000 maps. Users can correct any errors. See our Text On Maps Help Guide for detailed descriptions on using this exciting new feature.
Cool animated map shows the elevation profiles for major Scottish rivers. Yes, this might sound obvious but I love how this map by @stevefaeembra shows how rivers flow from higher to lower altitudes. #geography#geographyteacher
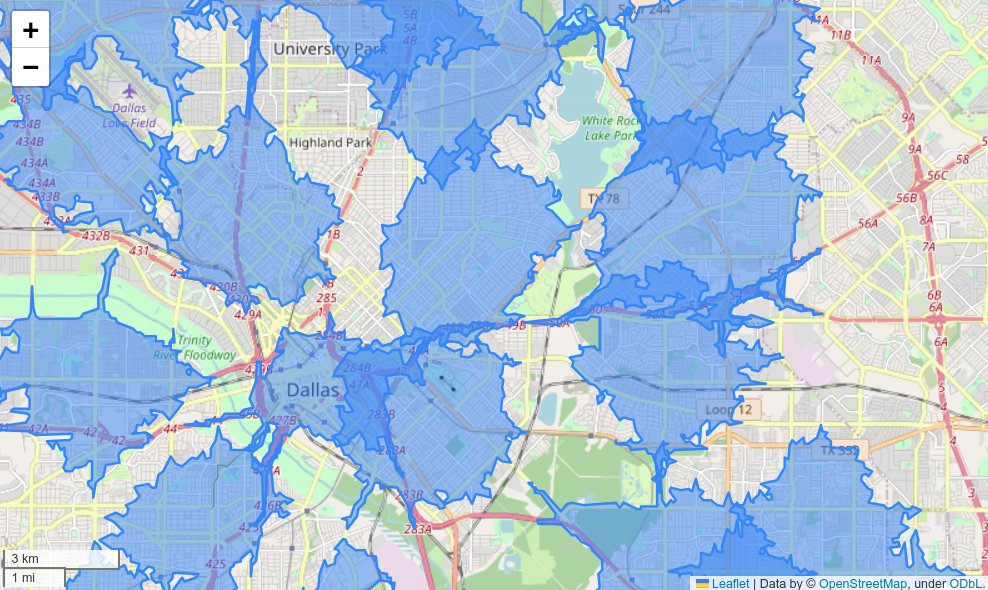
New on the blog: how to get @Mapbox travel-time isochrones as @geopandas GeoDataFrames in #Python
You'll learn how to link the routingpy package to GeoPandas, setting you up to perform powerful #GIS analyses in Python w/ Mapbox services
Read it here: https://t.co/D0BojXi8NF
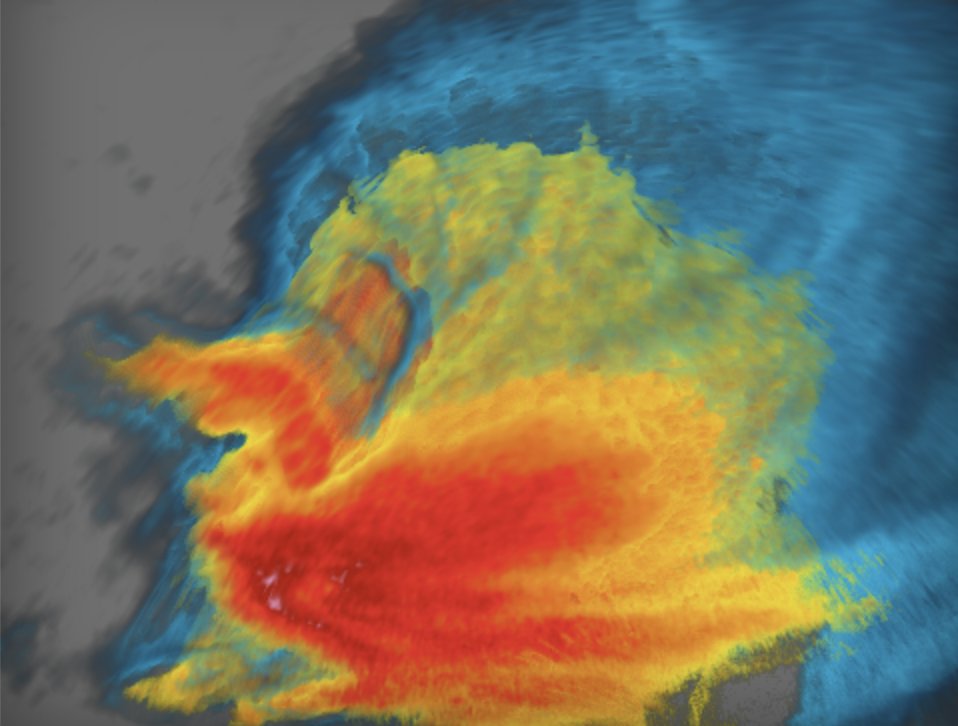
It's been 1 year since https://t.co/s7S84KxDBn launched with the goal of bringing desktop radar software to the browser. I'm grateful to everyone who has used it to analyze and be in awe of severe weather. I'm still amazed by some of the imagery that comes out of it!
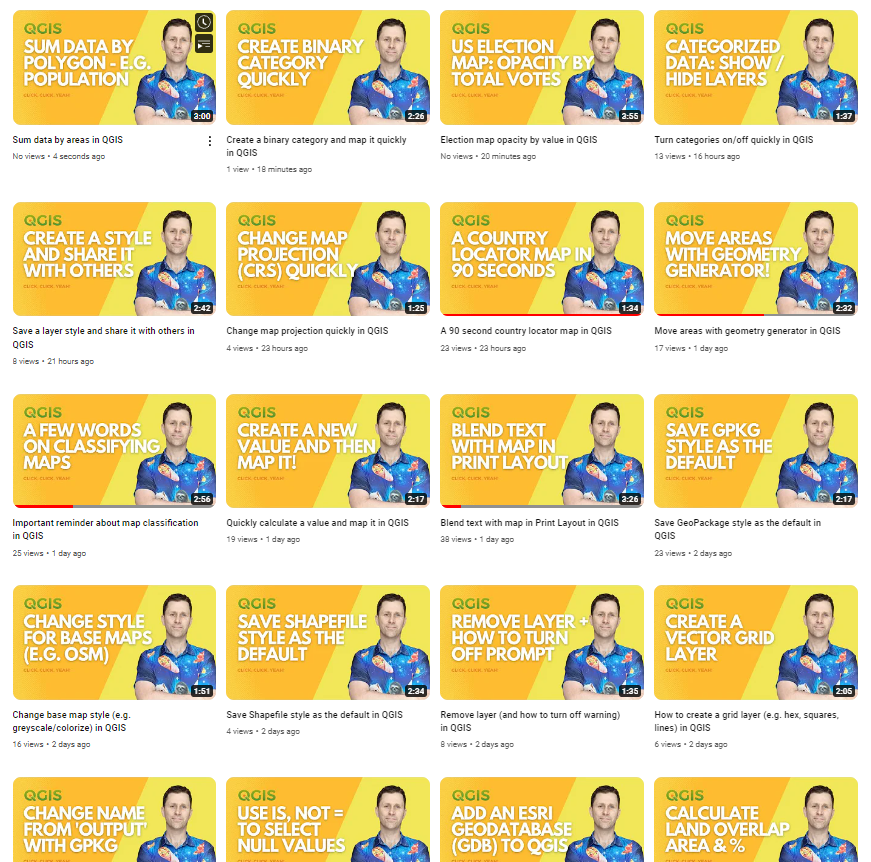
110 QGIS videos and one bad shirt on the channel now, including:
- how to get data from that web map
- summing populations by area
- change map opacity by population value
- blend text with map in print layout
- calculate area overlap %
- glowing lines
https://t.co/3HVeRZEaFY
Finally got shadows to work on a 3D @mapbox terrain map using @threejs! We'll use this in our free wind turbine visualization @Observablehq notebook once it's ready 😊
https://t.co/0KfVFFIWXN