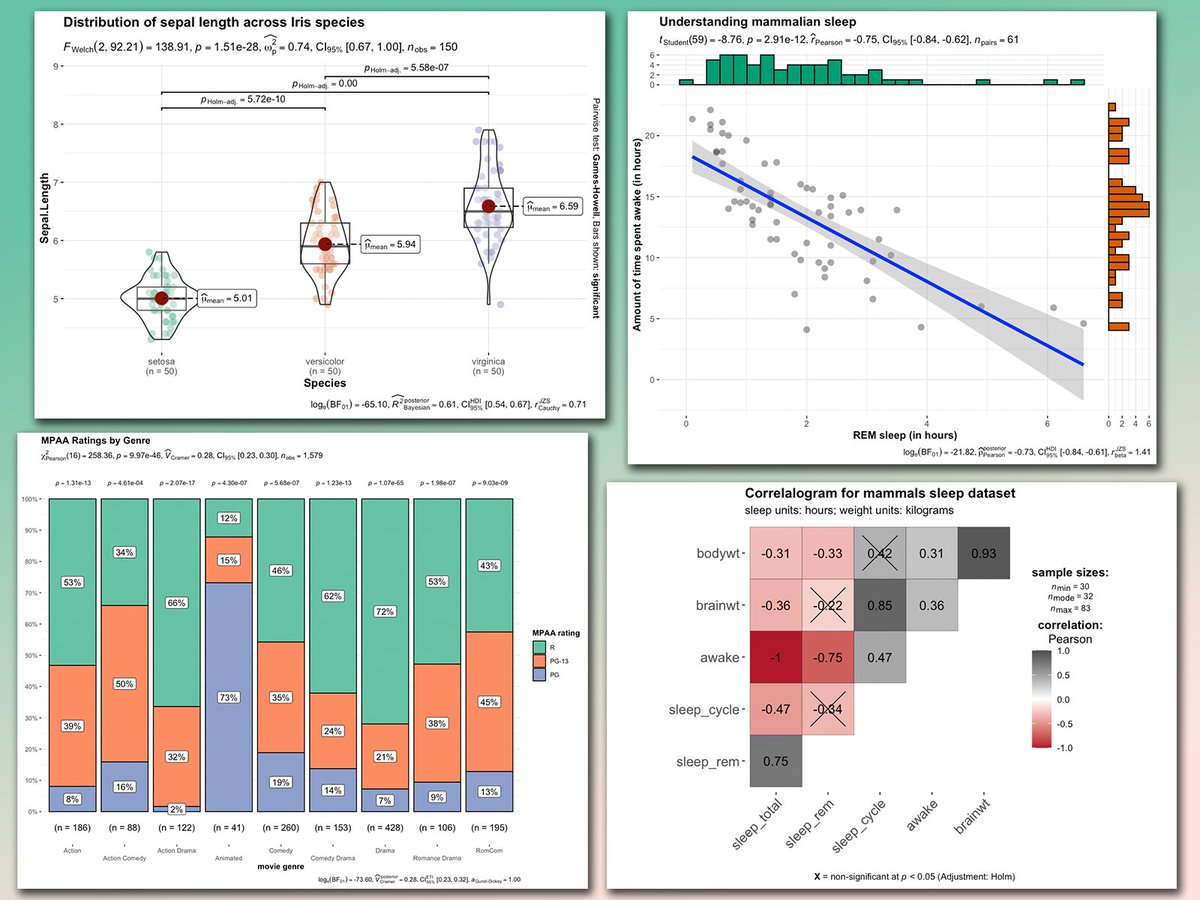
Looking to add statistical insights directly to your ggplot2 visualizations? The ggstatsplot package simplifies this by incorporating statistical tests, effect sizes, and other analyses right within your plots.
✔️ Enhanced Visuals: Automatically includes statistical information in your plots, providing clear insights without the need for extra steps.
✔️ Wide Range of Analyses: Supports various statistical tests, including t-tests, ANOVAs, correlations, and more, making it versatile for different types of data sets.
✔️ Customizable Output: Lets you control which statistical details are displayed and customize the appearance of plots, ensuring clarity and focus on key findings.
✔️ Seamless Integration: Designed to work directly with ggplot2, using the same syntax and functions you’re already familiar with.
The visualizations shown here are from the package website and demonstrate how ggstatsplot integrates statistical results seamlessly into ggplot2 graphics: https://t.co/kQ1KUseS6u
Want to deepen your knowledge of ggplot2 and learn how to create informative visualizations? Join my online course, “Data Visualization in R Using ggplot2 & Friends,” starting on November 25, 2024!
Claim the early bird promotion before it closes on November 6.
Further details: https://t.co/ztlEzoEDWv
#DataVisualization #Statistical #programmer #VisualAnalytics #database
🚀Announcing the first version of WorldfootballR Handler One! 🧙♂️
A #Shiny app that lets you download football data with ease using the amazing #worldfootballR package by @JaseZiv. ⚽📊
Check it out here: https://t.co/lFnSgWiLKh
#RStats#DataScience#Football#ShinyApp
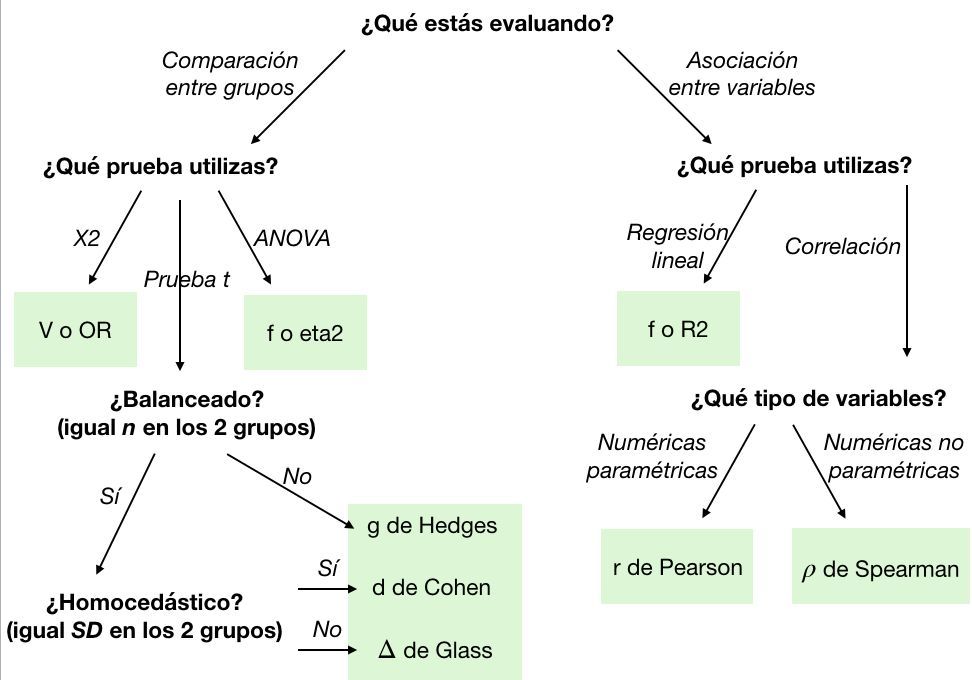
📏 Un resultado estadísticamente significativo no implica automáticamente que tenga una relevancia práctica o aplicabilidad en el mundo real.
👀 ¿Cómo estimar la "significación práctica"? Puedes calcular tamaños de efectos (ver imagen) pero ten en cuenta lo siguiente....🧵
#stats
I've just submitted my #RStudio Table Contest 2021 entry; a tutorial for the {gt}📦 intended for #AirQuality professionals. A key victory - getting {gt} to work with {#openair}!
Tutorial: https://t.co/hyQ83qISIC
GitHub: https://t.co/vf9YlVZnp6
Submission: https://t.co/bP77cikoA4
🎉 We've just crossed 5000 Datasets! 🎉
We now index and organize more than 5000 research datasets for machine learning. A huge thanks to the research community for their ongoing contributions.
Browse the full catalogue here: https://t.co/lO4NpjIR9q
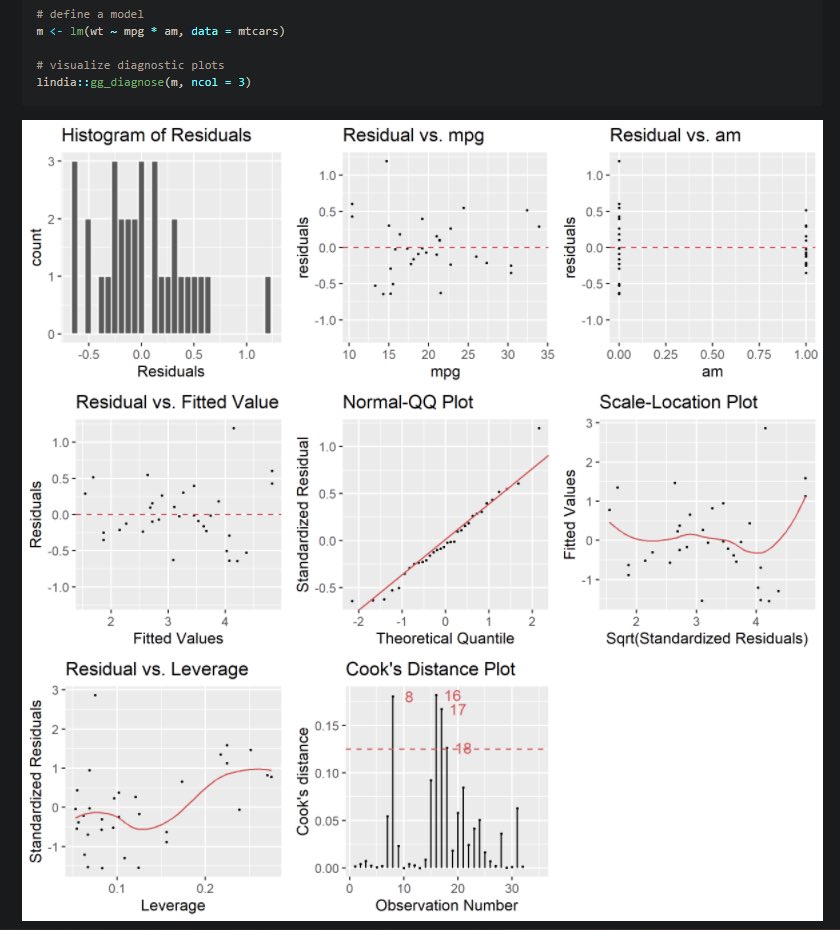
Sometimes we may wish to check all relevant assumptions for a linear regression model in one go.
The {gg_diagnose} function from {lindia} 📦 does this for lm objects and provides helpful {ggplot2} visualizations ✅📊
https://t.co/12Q5NT3c6P
#rstats#DataScience
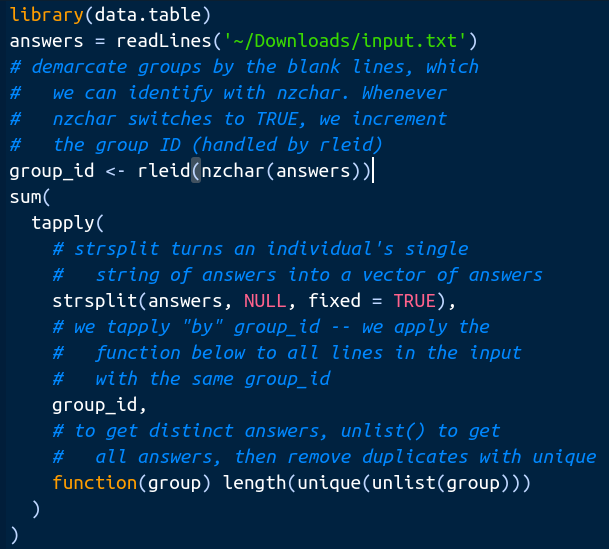
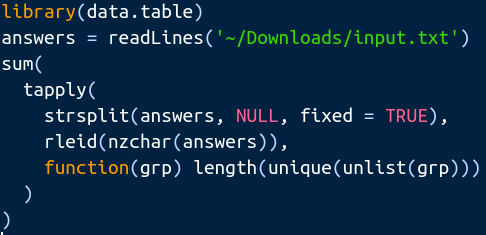
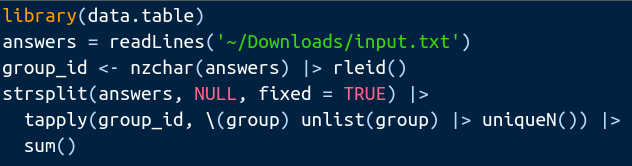
#rstats#rdatatable's rleid makes for a handy quick solution to the #AdventOfCode. A wild tapply() emerges 🙃
2nd shot has some explanations; 3rd shot has some #basePipe action for fun
Esto merece romper mi silencio en redes que me autoimpuse por motivos de salud-> Se han detectado viriones de SarsCoV2 en mucosas de pacientes con COVID persistente 3 MESES DESPUÉS de fase aguda.