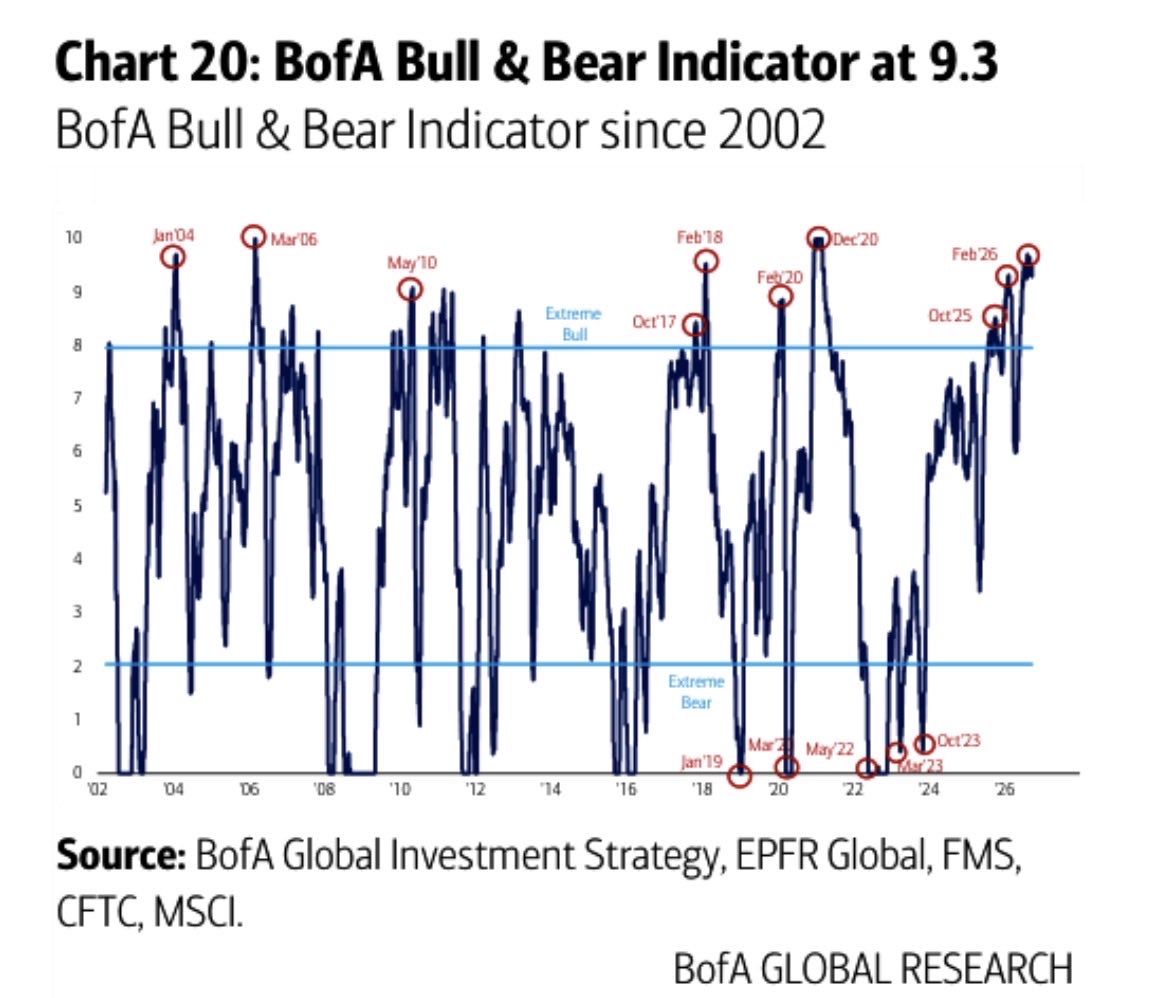
Since I’m on a BofA kick, their Bull and Bear indicator remains at an extreme and is a contrarian signal for longer-term investors to consider.
This extreme reading is also occurring at levels that are of consequence to investors.
Source: Bank of America
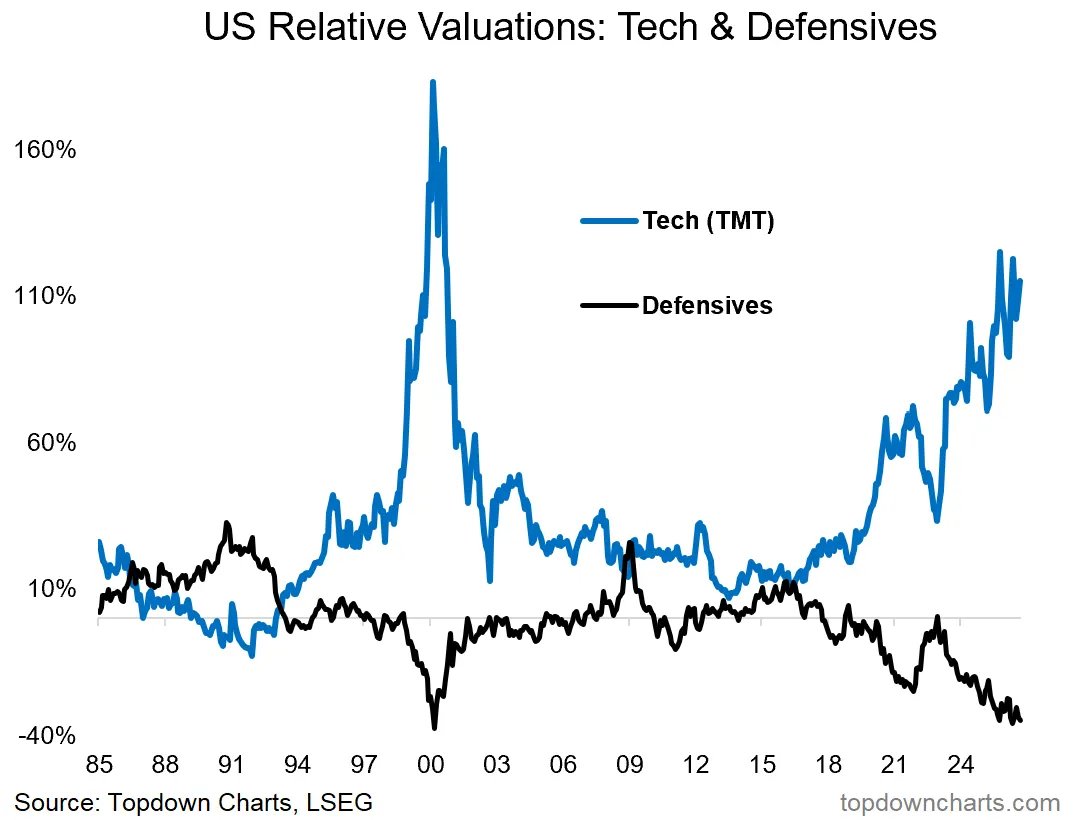
This is one of those rare and unique charts that does something special...
It tells us two things:
-tech is extreme expensive
-defensives extreme cheap
There is a strategic insight in there; look for opportunities in the cheap thing.
But also a market analysis insight; this is basically a sentiment signal...
It's what call a "rubber band chart"
The more it stretches, the bigger the snap
(..when snap? 👀 )
Whoops, this is a little scary. The S&P 500 is near all-time highs, yet 100+ NYSE common stocks made new 52 week lows than highs.
This is the weakest reading since almost bear market in 2025. 7 of these 8 cases occurred before a major top in $SPX.
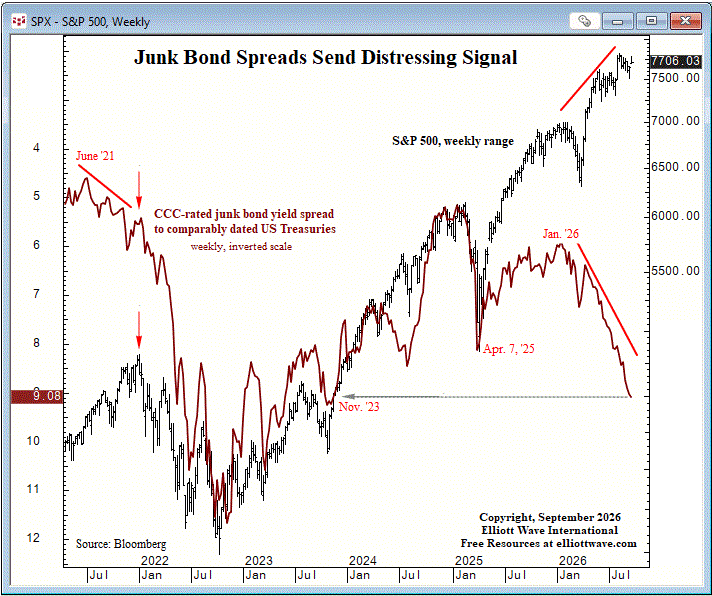
Junk bonds continue to sound the alarm.
CCC-rated junk bond spreads are widening while the S&P 500 remains near its August peak.
Historically, when these markets diverge, stocks have eventually caught up with the trend in junk spreads. And the bigger the divergence, the bigger the potential catch-up.
This is a chart we'll be watching closely.
See 18 charts sounding an alarm in the markets: https://t.co/seEAAcBrP7