Ph.D. Data scientist in the 🧬 field. #Rstats fan and #tidyverse supporter. Musician, reader and video gamer in the free time. He/him. Opinions are my own.
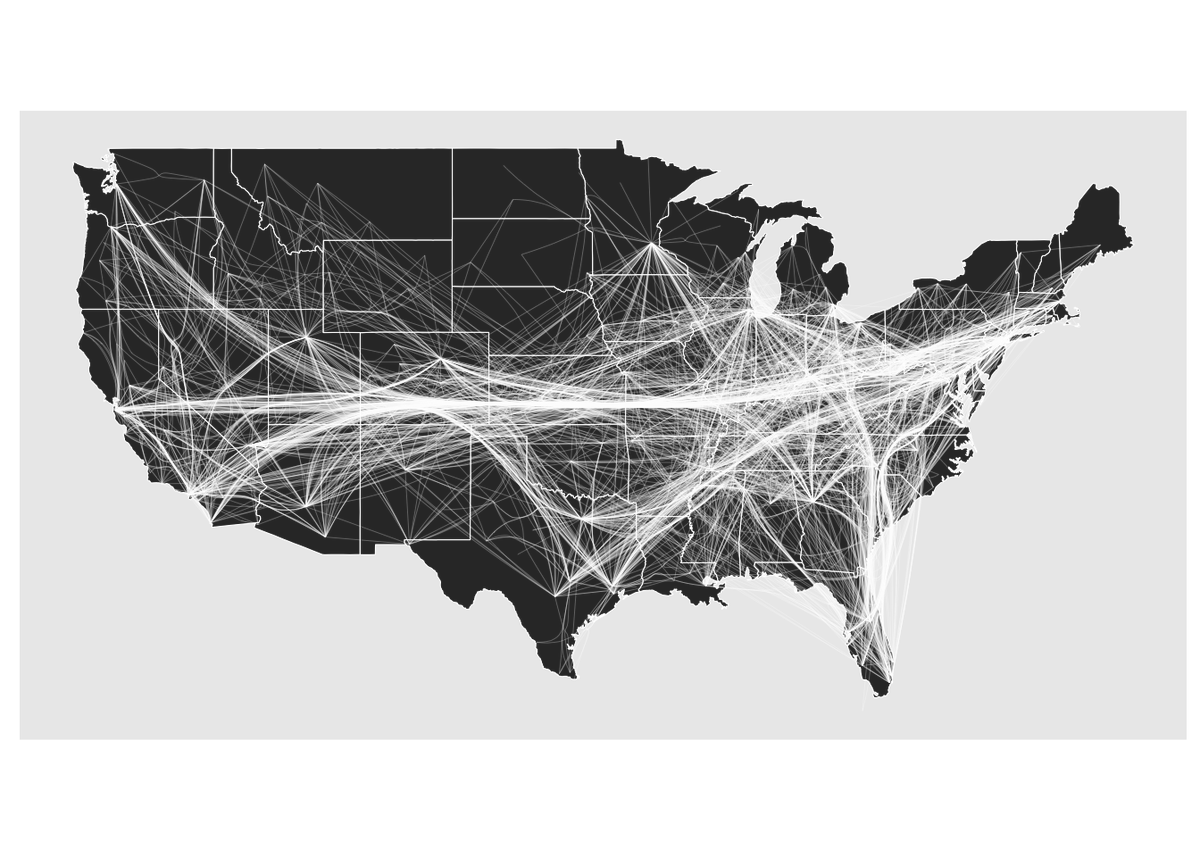
Interactive heatmaps that "fade away" as you zoom in, revealing points with a custom pop-up?
You can do it all in #rstats.
Learn how: https://t.co/Ns6jcYSTE5
At the #ADASciSessions to present about variants affecting IR in the largest genome-wide association study of an IR marker to date. Join me at 2.30 PM ET time.
#UMPrecisionHealth members @anto15392 Elizabeth Speliotes, Kelly Cushing-Damm and Vincent Chen’s research on insulin resistance is ft in this highlight by @JinaSawani (@umichmedicine)! Read on:
È fondamentalmente sbagliato parlare di “carne sintetica”. Ma se anche fosse, non è chiaro il motivo (a parte l’ignoranza) per cui non abbiamo nessun problema in assumere farmaci o integratori futto di produzioni in vitro o in bioreattori ma ci si scandalizza per una bistecca.
Minithread. La stragrande maggioranza delle alterazioni genetiche che accumuliamo fin dalla prima divisione cellulare dello zigote non ha conseguenze significative. Questo perché, essenzialmente, non sono coinvolte zone del DNA chiamate geni.
In Boston for #TLM2023! On Nov 11, join me as I present on the effect of keto diet for those at high risk of fatty liver disease. On Nov 12, learn about genetic variants that increase the risk of developing alcoholic hepatitis and cirrhosis. Both presentations kick off at 1 pm!
In DC for #ASHG2023! Really excited about the opportunity to meet other scientists and hear about their research! I'll be presenting a poster on genetic factors contributing to the development of alcohol-related liver disease. Feel free to stop by: Nov 2, 3-5pm. Let's connect!
Are you and your co-authors editing the abstract of your paper again and again before submitting to get it just perfect?
👇 Use this template instead and save yourself hoursss!
🧵 A thread.
What gets erased when you integrate #singlecell data across samples/studies, and can you get it back? When samples are from e.g. healthy & disease, should you simply massage cells together? FINALLY, I feel we can answer this question: https://t.co/0PrkIZDyDp
Se i media non cominciano a discernere professionisti da principianti e continuano a mettere sullo stesso piano amateur con esperti non ne veniamo a capo. L’informazione scientifica deve essere fatta da chi la scienza la vive e la capisce. Non da spaventapasseri.
🧵 Writing the Statistical Analysis Section of a Manuscript: A Guide
1/ 📜 Introduction:
When drafting a manuscript, the statistical analysis section provides clarity on how you analyzed the data. It's the backbone of your results, ensuring your findings are robust and credible.
2/ 📌 Start with Objectives:
Begin by reiterating the study's objectives or research questions. This sets the stage and reminds readers why certain analyses were performed.
3/ 📊 Descriptive Statistics:
Mention the basic descriptive statistics you utilized. This includes measures of central tendency (mean, median) and dispersion (range, standard deviation).
4/ 🔍 Specify the Tests:
Clearly state which statistical tests were used for each analysis. Whether it's t-tests, ANOVAs, regression analyses, or chi-square tests, be specific.
5/ 🛠 Software & Version:
State the statistical software package and version used. E.g., "All analyses were performed using R version 4.0.2."
6/ 🧮 Assumptions:
For many statistical tests, certain assumptions need to be met. Discuss any checks you performed (like tests for normality) and how any violations were addressed.
7/ 🔄 Handling Missing Data:
Address how you dealt with missing data – whether you used listwise deletion, imputation, or another method. Transparency is key!
8/ 🚫 Correction for Multiple Tests:
If you conducted many tests, discuss how you corrected for multiple comparisons (e.g., Bonferroni correction) to reduce the risk of Type I errors.
9/ 📈 Effect Sizes & Confidence Intervals:
Besides p-values, mention any effect sizes (like Cohen's d) and confidence intervals. They provide additional insight into the practical significance and precision of estimates.
10/ 🔄 Sensitivity Analyses:
If you conducted any sensitivity or supplementary analyses, briefly describe them. This showcases the robustness of your primary results.
11/ 🤝 Collaboration:
If you collaborated with a statistician or data analyst, mention this. It can enhance the credibility of your analysis section.
12/ 📝 Clear Language:
Use clear and concise language. Avoid jargon. The goal is to make it accessible to readers from diverse backgrounds.
13/ 🔄 Replicability:
Where possible, provide supplementary material (like a code or dataset) that would allow others to replicate your analysis.
14/ 💡 Conclusion:
Wrap up by emphasizing the rigorous approach you took. Reinforce that your methods were appropriate for answering the research questions.
15/ 🙌 Feedback:
Once your draft is ready, consider getting feedback from colleagues or a statistician. A fresh pair of eyes can spot ambiguities or errors.
📌 Final Thought:
A well-structured statistical analysis section lends credibility to your research. It ensures your study's findings are both valid and reproducible. Happy writing! 🖋
If you found this thread helpful, please like, share, and comment! #Statistics #DataScience #ResearchTips
Dive into "How To R: Visualizing Distributions" with insights from Nick Martin. A must-read for those passionate about data visualization! 📊 🔗: https://t.co/LMIZzq8rQL #dataviz#DataVisualization#Rprogramming#DataAnalysis