The second visualization I made is the distribution of the categories of the companies founded from 1951-2020 according to Crunchbase. These are tags assigned by Crunchbase using their own algorithm/methods.
#startups#visualization#dataisbeautiful#Entrepreneurship#Python
@claudeai@_catwu It'll be super cool if I can see a live notification on the iPhone when Claude code is running. I think it'll bring me one step closer to feeling like Iron Man
@iamvinayaknair@dgxfenmo@aditi_tibarewal Leaving the actual link here was opening it up to spam. Can you DM me for the link please? Can’t DM you since I’m not verified.
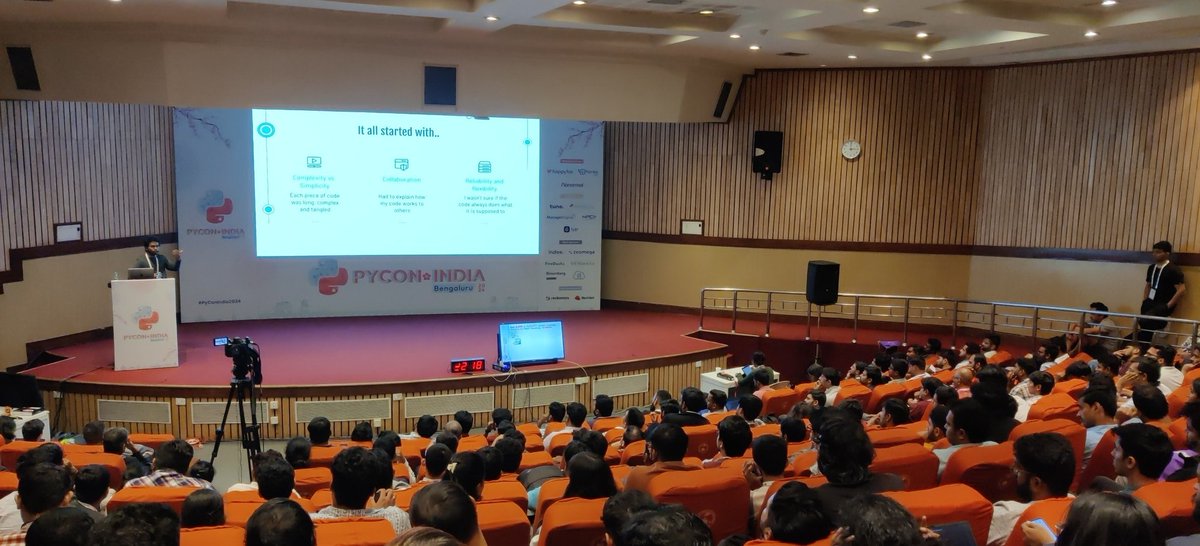
🚀 We are excited to introduce @anujmenta at #PyConIndia2024!
🎙 Join us for his talk on “From Code to Craft: Software Engineering Principles for Python Programmers”
🐍 #Python#TechTalks
The second visualization I made is the distribution of the categories of the companies founded from 1951-2020 according to Crunchbase. These are tags assigned by Crunchbase using their own algorithm/methods.
#startups#visualization#dataisbeautiful#Entrepreneurship#Python
@trickseye @Anubhavg94 @ycombinator@sequoia@EU_EASME@techstars@500Startups@intelcapital@Accel That sounds like a great idea. The one bottleneck is that the data is not as widely reported as the number of investments made and might not be the most accurate representation. Also, it's hard to know how much has each participating VC invested in a round.