On March 3, the #GDPNow model nowcast of real GDP growth in Q1 2025 is -2.8%: https://t.co/T7FoDdgYos. #ATLFedResearch
Download our EconomyNow app or go to our website for the latest GDPNow nowcast: https://t.co/NOSwMl7Jms.
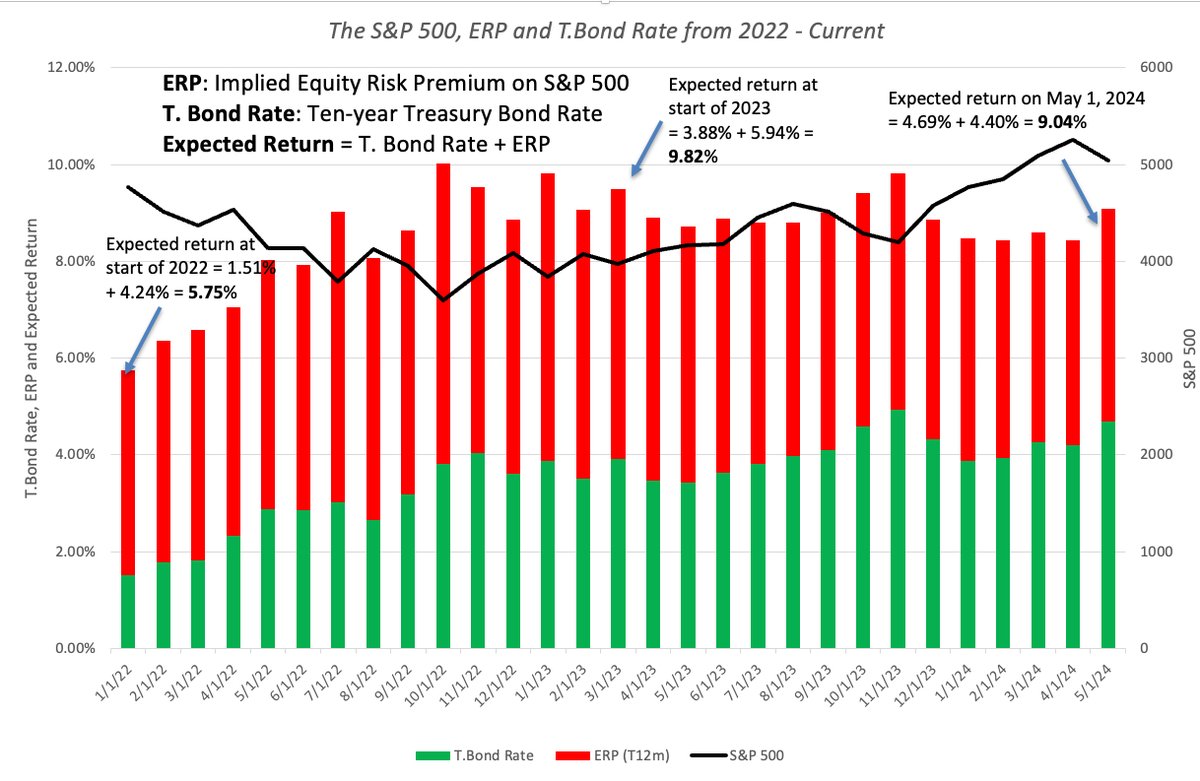
The S&P had its first rough month of 2024 in May, with stocks down, the https://t.co/jhPnIWv20l rate up and the ERP rising to 4.40%. Blame the fundamentals (inflation & the economy), not the Fed! ERP spreadsheet: https://t.co/TeH8Dqj4aw, Home Page: https://t.co/wy8WGu8ona
THIS WEEK'S HIGHLIGHTS ⚠️
1. Moody’s set the US credit rating outlook to ‘negative’ and stated that political risks (brinksmanship surrounding debt ceiling and possible govt. shutdowns), the fiscal deficit and debt affordability were their major issues of concern.
• This is not the same as Moody’s downgrading the US debt rating from its AAA status, a rating Moody’s is the last major agency to hold. However, it likely precedes a downgrade, or at the very least makes it much more likely and is a warning shot to say they are considering it.
• As aforementioned, Moody’s is the only major credit rating agency that still holds the US government debt with a triple A rating. Both Fitch and S&P have previously downgraded, with Fitch taking this action following the debt ceiling crisis that was averted last minute back in June this year.
• The worry from markets surrounding a downgrade to the US Treasury debt is that it would result in structurally higher borrowing costs (higher Treasury yields). However, the caveat to this is to understand that US Treasury debt is still the most liquid, safest and important asset market on Earth and it is already split rated (i.e. S&P and Fitch have lower than AAA ratings). The impact may be lesser than anticipated.
2. The US Treasury had a $24 billion 30Y Treasury auction that saw weak demand. The primary dealer award climbed to its highest in 2 years. The auction tailed the when issued by 5.3bps and the bid to cover ratio came in at 2.24.
• The bid-to-cover ratio is the ratio of bids vs the amount of Treasurys being sold and thus is said to give insight into the level of demand in a Treasury auction. This is much lower than recent bid-to-cover ratios, suggesting lower demand. it is an imperfect indicator as it does not take into account the prices of bids.
• Primary dealers are large financial institutions that have to take on board any Treasuries that are not sold to the wider market. They took 24.7% of the auction, much larger a stake than has been seen of late. This also suggests that demand from other bidders, that are not mandated to purchase Treasuries, has fallen markedly for longer dated securities.
• Simplified, when issued essentially represents market expectations of what yield the Treasurys in the auction will be sold at. The fact that the auction tailed the when issued means that the yield was higher than expected and thus demand for the auction was well below expectations. This is a substantial when issued tail and the largest since 2016.
3. The University of Michigan Consumer Sentiment Survey inflation expectations report continued to climb, making Powell’s comments about inflation expectations remaining well anchored look like they could be called into question. 12-month inflation expectations came in at 4.4% (Exp 4%, Prev. 4.2%). On top of this, longer term inflation expectations also rose significantly and will most certainly catch the eye of the Federal Reserve. 5-10 year inflation expectations rose to 3.2%. (Exp 3%, Prev. 3%) This is the highest they have been in over a decade.
• Buying conditions in the survey also deteriorated in the consumer survey. Buying conditions for homes and vehicles are at their lowest since the 80s.
• Inflation expectation matter, a lot. They influence the behaviour of humans. Thus, expectations can affect actual inflation. If inflation expectations become ‘unanchored’, or rise with incoming data, then even if interest rates are elevated, they may not have the desired effect. Inflation expectations have a significant impact on monetary policy decision making.
• Powell has been talking at length about expectations remaining ‘well anchored’. The recent rise in expectations is not what the Fed will want to see.
• Former Fed chairman Ben Bernanke referred to ‘anchored’ inflation expectations as expectations of longer-term inflation that remain low even if in the short term there are spells of higher or lower than expected inflation.
• Rising inflation expectations in times of higher inflation make central bankers more itchy. The Fed' ultimate worry is that higher expectations of inflation make people demand higher wages and thus businesses raise their prices to protect margins, inflation rises, and the cycle continues, becoming very difficult for central banks to control. The concept is that of a wage-price spiral.
4. Powell gave a speech midweek that was interpreted as hawkish by markets. Powell could be heard saying ‘close the fuckin’ door’ on his microphone during a live speech that was interrupted by climate protestors. His speech re-iterated the hawkish rhetoric of his press conference following the latest FOMC meeting.
Key points:
• Fed not convinced rates are high enough to bring inflation to 2% target but policy is restrictive and putting downward pressure on economy and inflation
• They will continue to move carefully
• The economy has been much more resilient than expected citing it as ‘quite remarkable’ but expected to slow in coming quarters
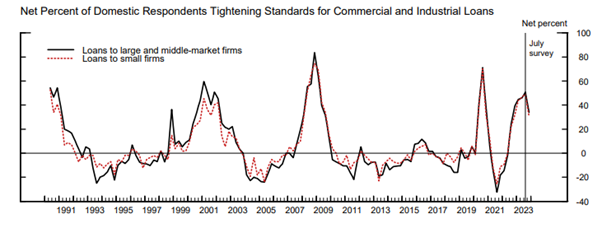
5. The Senior Loan Officer Opinions Survey (SLOOS) for Q3 was released this week. It showed banks continue tightening lending standards and demand for credit (borrowing) continues to decline. However, the proportion of banks that reported a tightening of conditions appears to have cooled since the second quarter. Thus, the level of tightening and demand waning in Q3 appears to have been to a lesser extent but is still significant, but us still very significant.
Banks tightening for business loans
• The SLOOS is a survey conducted by the Federal Reserve of US banks and US branches of foreign banks. It provides insight into the supply and demand picture of lending in the US on a quarterly basis.
• Larger shares of banks saw consumer loan demand fall in Q3 and residential mortgage lending standards tightened to a greater extent than in the prior quarter, with demand falling considerably.
• Lending demand for subprime mortgages took a particularly significant hit, which may suggest that the lower earners in the US are struggling. There was a VERY notable increase in the number of banks reporting falling demand for mortgages from subprime lenders. A net percentage of 71.4% of banks reported declining demand for subprime in Q3 vs only 9.1% in the prior quarter. This is despite the level of reported tightening from banks for subprime mortgages actually decreasing slightly quarter over quarter.
6. Initial jobless claims fell to 217K (Exp. 218K, Prev. 220K) while initial jobless claims climbed further to 1834K (Exp. 1820K, Prev. 1818K). The pace of layoffs in the US doesn’t appear to be rapidly rising but it seems clear that American’s that are becoming unemployed are finding it more difficult to find employment in a weakening American labor market.
Jobless Claims
• Since the start of September there has been a clear and persistent upward trend in continued claims.
• Initial claims tracks the number or people that are filing for unemployment benefits for the first time and continuing claims tracks the number of people that are filing for the 2nd or more time. As people struggle to find a job after becoming unemployed in a cooling labor market environment they are forced to file for unemployment benefits for a more prolonged duration, and thus continued claims accumulates.
7. US financial institution emergency borrowing INCREASED by $3.14 billion, now standing at $115.16 billion. Discount window (DW) borrowing DECREASED by $722 million, now at $2.23 billion. Borrowing via the Bank Term Funding Program (BTFP) INCREASED by $3.87 billion and now stands at $112.9 billion, a new record high and biggest increase week over week since the start of June.
• The Bank Term Funding Program saw a significantly larger demand for emergency borrowing in the most recent release from the Federal Reserve. This is worth keeping an eye on to see if is a once off or the start of a trend that could suggest some stress in US banks is re-emerging.
Bank Term Funding Program
• The DW and the BTFP are both means by which financial institutions can borrow emergency liquidity from the Fed. The DW has been around since 1914 while the BTFP was created in response to the banking crisis that started in March. The DW offers shorter term lending (up to 90 days) than the BTFP (up to 1 year); on top of this, the BTFP is more generous in than the DW, banks can post collateral (usually in the form of US treasury bonds, agency MBS, etc) at the Fed at par value, essentially meaning price fluctuations in banks' assets are ignored by the Fed when being used as collateral. This was designed so that banks are not forced to sell underwater portfolios and realise massive losses. To top it off, lending through the BTFP is done at Fed Funds + 0.1%.
8. UK GDP headline came in at 0% QoQ, actually -0.03% without rounding, (Exp. -0.1% Prev. +0.2%). Meanwhile, September GDP came in stronger at + 0.2% MoM (Exp. 0.0% Prev 0.1%).
• Services sector (the largest UK sector) GDP declined -0.1% QoQ, consumer facing services -0.7% and real household expenditure declined -0.4%. UK consumers spent less, especially on miscellaneous good and services, transport and food and alcoholic drinks. As sign that consumers in the UK are starting to feel the headwinds of the BOE rate hike cycle. This is important, consumer spending is the main driver of economic growth in the UK, accounting for over 60% of GDP production.
• Real estate activities fell 0.4%, likely due to the reduction in housing turnover as interest rates filter through to the economy. UK mortgage lending from the Bank of England is at historically low levels.
• There was a substantial drop in business investment of -4.2%
• Net trade contributed over +0.4% to the GDP figure, this was due to a big drop in imports (-0.8%) and uptick in exports (+0.5%). Trade balance (goods and services) = exports - imports. The drop in imports could reflect falling domestic demand, evidenced by other areas of the report.
Despite beating estimates for the 3rd quarter there is still weakness starting to show in the UK economy, likely more so than the headline figure suggests.
9. China fell back into deflation as CPI came in at -0.2% YoY (Exp. -0.1%, Prev. 0.0%). Monthly change was -0.1%.
• The drop was driven in large by a 4% fall in food prices.
10. Eurozone retail sales came in weaker than expected month over month at -0.3% (Exp. -0.2%, Prev. -0.7%) but better than expected on a year-over-year basis -2.9% (Exp. -3.1%, Prev. -1.8%). This is the reported VOLUME of retail sales, meaning it is the actual amount of goods being purchased. Europeans are buying less than before and measures of discretionary spending such as online goods and non-food posted very weak MoM figures, worse than the headline may suggest.
Some notable points from the retail sales report:
• German YoY volume of sales is down 4.3% YoY. Germany is responsible for almost 30% of Eurozone GDP and is by far the largest economy in the economic area.
• French YoY down 2.7% YoY but posted strong September growth of 0.4% MoM. The second largest economy in Eurozone.
• Spanish retail sales continue to power on, still up 7.5% from last year and 0.2% MoM. Spain is the 4th largest economy in the Eurozone.
• Italian retail sales down 5.1% YoY and posted strong contraction of -0.4% MoM. Italian retail sales have been notably weak not posting a single month of growth in the last 6, very poor for the 3rd largest economy in the Eurozone.
• The Netherlands posted marked contraction in retail sales MoM again at -0.8% and YoY -3.6%. The Netherlands is currently in recession and is the 4th largest Eurozone economy.
• European retail sales were exceedingly weak MoM in all categories other than food, drink and tobacco (+1.4%). Other categories include non-food (except automotive) -1.9%, online sales -1.9% and automotive fuel -0.9%.
• Retail sales are a barometer of consumer spending, the biggest contributor to GDP generation.
11. The Reserve Bank of Australia raised interest rates to 4.35% from 4.1%. This is the first rate hike in Australia since June. The RBA have continued their hiking cycle after a pause.
-
Europe and the UK certainly appear to be feeling the economic headwinds of the hiking cycle faster than the United States. UK GDP, although not in contraction enough to deliver a negative headline, was very weak and likely does not bode well for the country in the coming quarter as clears signs of domestic demand shone through.
Overall, a less packed week than last. The announcement from Moody’s came after the bell on Friday and the market response is yet to be seen as a result. Banks continued tightening financial conditions, as shown in the SLOOS. The Fed will not be happy and will be keeping a close eye on inflation expectations as Powell has repeatedly stated they have ben glad so far to see them remain well anchored.
Despite Powell's hawkish rhetoric of late and rising inflation expectations, markets are pricing in a >90% chance of another Fed pause at their meeting in December with hikes priced in for June.
🌎Global manufacturing PMI data for June paints a bleak picture. Only 10 out of 31 economies reported higher output, with India 🇮🇳 and Thailand 🇹🇭 leading the pack. Meanwhile, Czech Republic 🇨🇿, Austria 🇦🇹, and Italy 🇮🇹 saw the steepest production declines.
🇺🇸 Conference Board Leading Index has declined -9.4% (prev. -8.7%) from ATH. Does this mean that a recession is imminent?
📊Use Toolbox to build your recession indicator for free🆓: https://t.co/4nhR3jTgVH
🇺🇸 Starting from the second half of 2022, there has been a significant divergence in job vacancies in the United States, according to data from employment website Indeed. Tech sector is facing a wave of layoffs, while the service industry job market remains tight.
🇺🇸 Conference Board Leading Index has declined 📉 by 8.74% (prev. 8.15%) from its all-time high, indicating a clear signal of an upcoming #recession.🚨
📊Use Toolbox to build your recession indicator for free🆓: https://t.co/4nhR3jTgVH
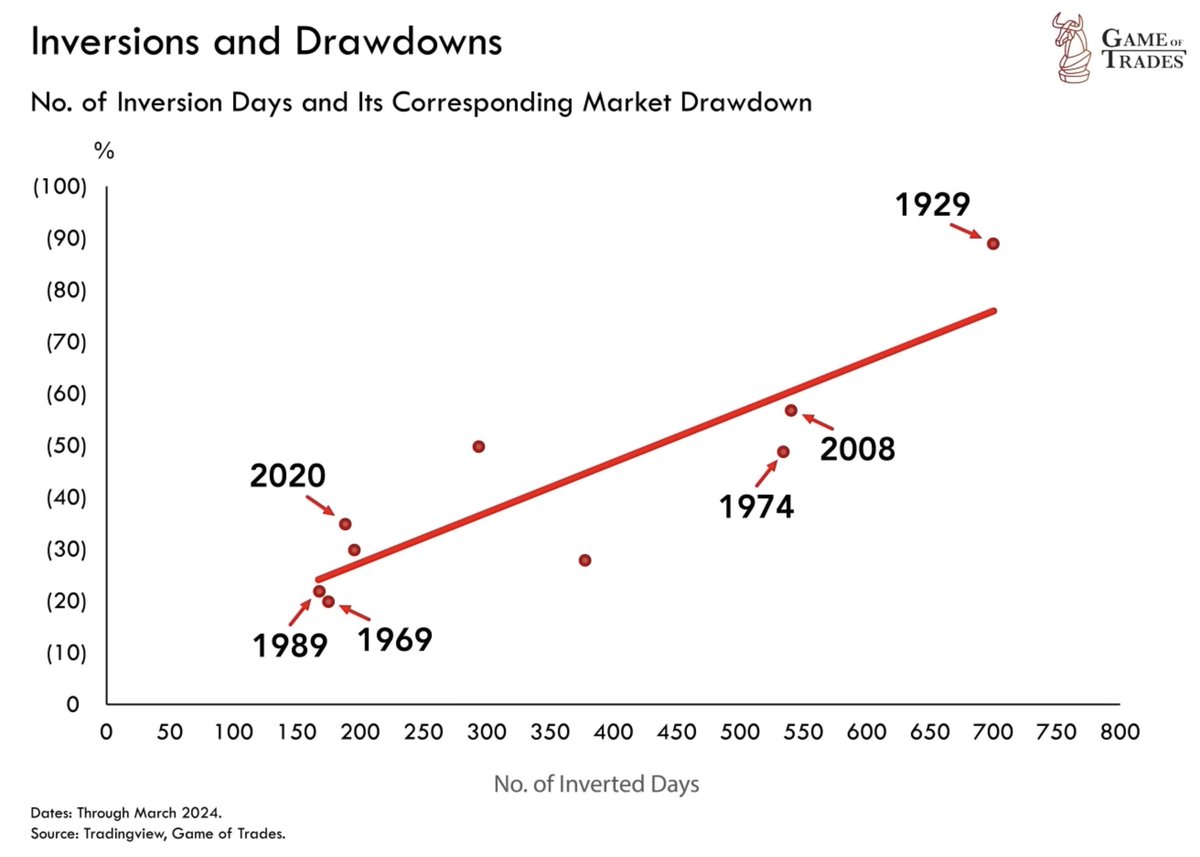
🇺🇸🚨The inversion level of #Powell's favorite yield curve (short-term yield spread) hit a historic high after this week's #FOMC meeting, signaling greater #recession risks and potential interest rate cuts ahead. #Fed