Sameer is right 👍. get base14 Scout for all your telemetry signals, correlate on the same platform, and reduce MTTR by 50%
#observability#opentelemetry
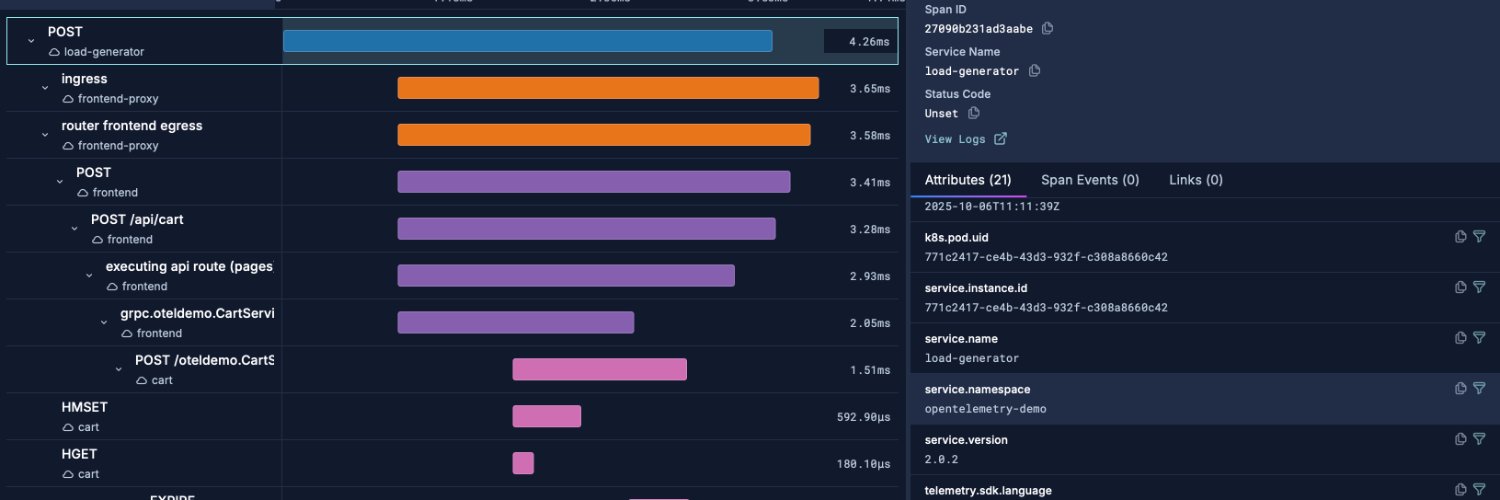
Observability rule of thumb:
📊 Metrics detect
🧾 Logs explain
🔍 Traces prove
If you need 3 tools to understand one incident, your signals aren’t correlated yet.
Observability isn’t more https://t.co/9QVSKhqGuF’s shared context.
#Observability#SRE#SystemDesign
eBPF can surface telemetry orthogonal to app-level instrumentation in Go, revealing kernel-level context and signal.
Here's a practical guide to eBPF-based instrumentation in Go with examples and considerations for production
https://t.co/relvexfqmw
#GoLang#eBPF#Observability
Spring Boot powers your production systems. Observability should be consistent and predictable.
Here is a practical guide to auto-instrumenting Spring Boot - covering traces, metrics, and correlated logs.
https://t.co/M7xRbYjnqd
#SpringBoot#Java#OpenTelemetry#Observability
Laravel makes building apps joyful.
Debugging them in production. not so much.
Here’s a practical guide to auto-instrument Laravel with OpenTelemetry—traces, metrics, and logs, without rewriting your app.
👉 https://t.co/RVMhblThjE
#Laravel#PHP#OpenTelemetry#observability
Quarkus is built for fast startup and low memory.
Your o11y should keep up.
Here’s a practical guide to auto-instrument Quarkus with OpenTelemetry - traces, metrics, and logs, no framework gymnastics.
👉 https://t.co/KGCgJVHPAy
#Quarkus#Java#OpenTelemetry#Observability#SRE
FastAPI makes it easy to ship APIs.
Observability? Not so much.
Here’s a practical guide to auto-instrument FastAPI with OpenTelemetry—clean traces, metrics, and logs, without rewriting your app.
👉 https://t.co/HYAg2GblI3
#FastAPI#Python#OpenTelemetry#Observability
Building web applications with Axum on Rust? This guide provides a comprehensive approach to enhancing observability in your application using OpenTelemetry and Scout.
Explore the details here:
https://t.co/9xBqpVjxDg
#rust#observability#opentelemetry#devops#axum
planning to instrument and monitor https://t.co/8A5DnfE24O applications with open telemetry ? here's a comprehensive guide using Scout to monitor C# https://t.co/hP4q3Ou7bH applications https://t.co/aCQp5hrKTw
So I made a thing. a place to help find out which systems emit what metrics, and the source of emission.
live registry: https://t.co/jxDvO1AAj4
blog: https://t.co/5f3CWXeD7r
source- https://t.co/NFAPzXFl9S
When database signals live outside the core observability stack, teams pay the price in slower diagnosis, fragmented ownership, and reduced confidence in change.
Full article: https://t.co/snAIh9DXo7
For CTOs and VPs of Engineering, selecting a database monitoring tool is often driven by how deeply it can inspect the database. The better investment combines that depth with tight integration into application and infrastructure observability.
meet Scout pgX - the most comprehensive integrated postgres #observability tool out there. Go from APM view to details about connections, replication, locks and waits, tables, indexes, maintenance and vacuums, DB performance, resource usage and topology 👉
https://t.co/teOJe9DltK
If you can’t see your system,
you can’t fix your system 🔍
Logs, metrics, and traces are not “nice to have”.
They’re production survival tools.
#SystemDesign#Observability
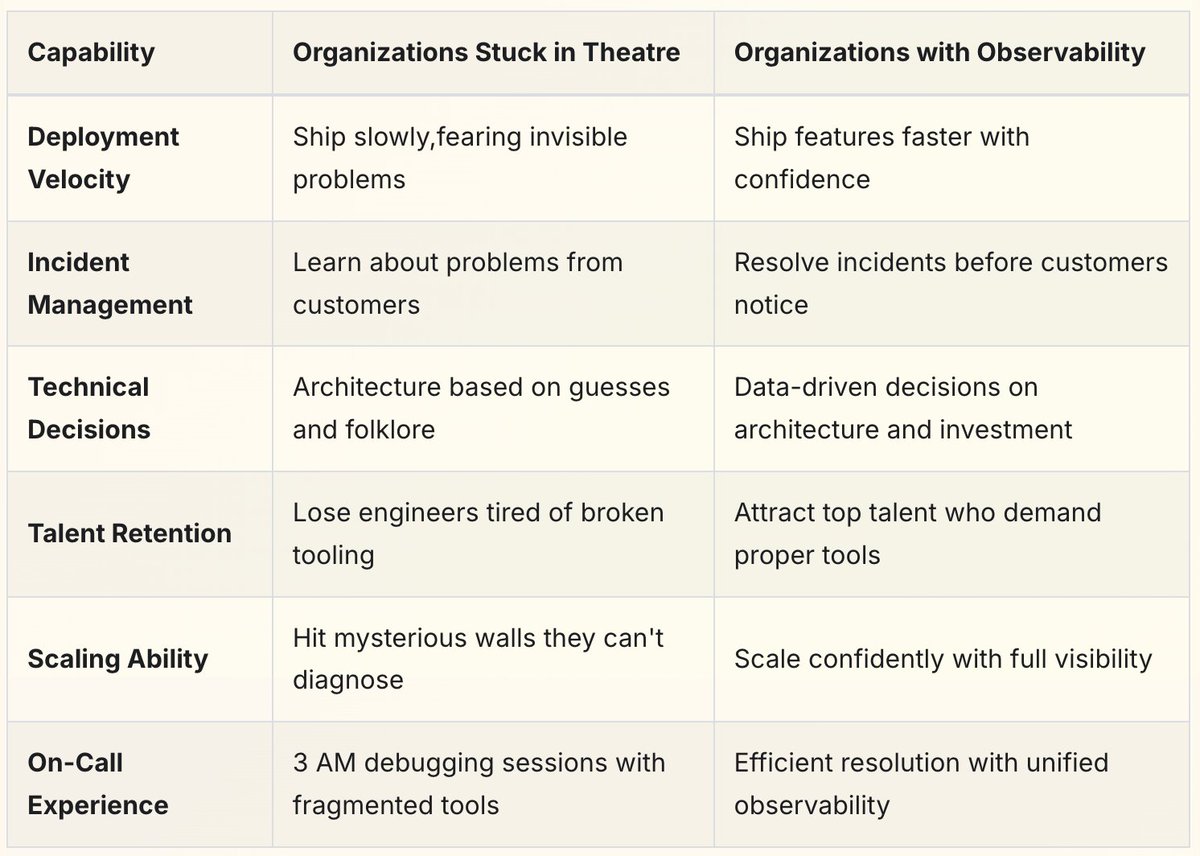
When the CEO forwards a customer complaint asking "are we down?", that's when the dev team gets to know about incidents.
You're experiencing observability theatre—the expensive illusion of system visibility without its substance. https://t.co/jdnT2CXonF
Your organization has invested millions in observability tools. You have dashboards for everything. Your teams dutifully instrument their services. Yet when incidents strike, engineers still spend hours hunting through disparate systems, correlating timestamps manually
Introducing pgX - get 500+ timeseries high res postgres o11y data right next to your application and infra o11y.
slowAPI -> slow Query -> connection issues, locks, indexes, cluster and delays, vacuums - without any tool hops.
https://t.co/r7EktuJBOS