80% of Dharavi's buildings have an area of less than 100 sq.m. Here's a viz of Dharavi's building footprint based on the Google Open Building dataset. #Mumbai@richielionell
Tell your girl child that the sky is the limit.
"66% of the teenage athletes at the #Olympics were girls."
Our analysis of age and gender at the 2024 Paris Olympics, published by @ThehinduData@richielionell
Come for the snazzy bar chart race.
Stay for the moment when its message sinks in.
I'd be really interested to see post-2020 data to get a sense of the effect the pandemic had on this.
Hope you enjoyed our work from the Bezalel Data Studio in 2023. We look forward to having more fun with data in the new year.
#datavisualization#storytelling#art
A #TreeBar race of inward #remittances from 2000 to 2023.
Remittance estimates for 2023: $860 billion.
#India's inward remittances in 2023: $125 billion.
Tajikistan's inward remittances of $5.7 billion is 48% of their GDP.
Data: @GlobalKNOMAD@WorldBank
Visuals: @richielionell
Is there a #law in your country that mandates 👩🏽🔧 👨🏽🔧 equal #remuneration 💲for work of equal value? In 1973 only 2 countries had a law mandating equal remuneration. In 2023 - 97 countries.
Visual analysis: Bezalel Data
Data courtesy: The World Bank
#equalpayday#equalpay
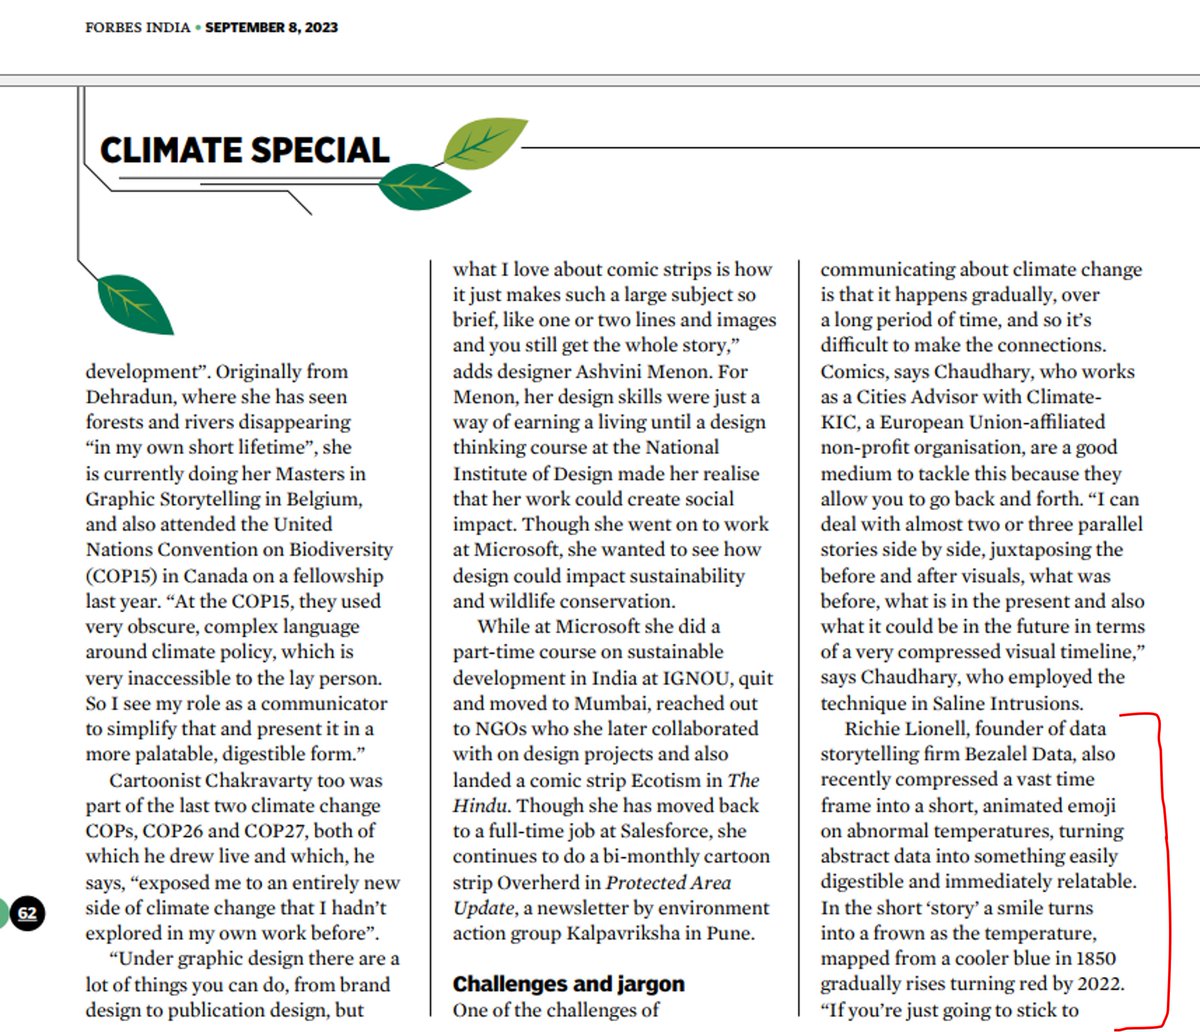
Thank you @ForbesIndia for featuring Bezalel Data 's work 😊
@MBathija3 writes "Can graphic novels and cartoons raise awareness about climate change? These artists are leading the way"
Read the article at https://t.co/99wC3yrndJ
#climate#communication@richielionell
This is the annual global land & ocean temperature anomalies from 1850 to 2022. We are definitely getting warmer from 1980 onwards.
Data source: @NOAA
Visuals: @bezaleldata