I'm pumped to be speaking at rstudio::conf(2022) this July!
Come join me (and stay for all the other amazing talks) The Benefit of Talking to the "Non-Datas" https://t.co/WnJjbinFIj @sched#rconf
When you leave #rstudioconf22 and are immediately inspired to remake your website in quarto and are *SHOOK* at how easy it is 🤩
10/10 highly recommend #quarto
Yall! #rstats {infer} v1.0.0 is on CRAN!🌲
This is a major release introducing several new features, improving internal consistency, and fixing many bugs.
Learn more about the package and what’s new in v1.0.0 in this post on the tidyverse blog:
https://t.co/sISonvjgNH
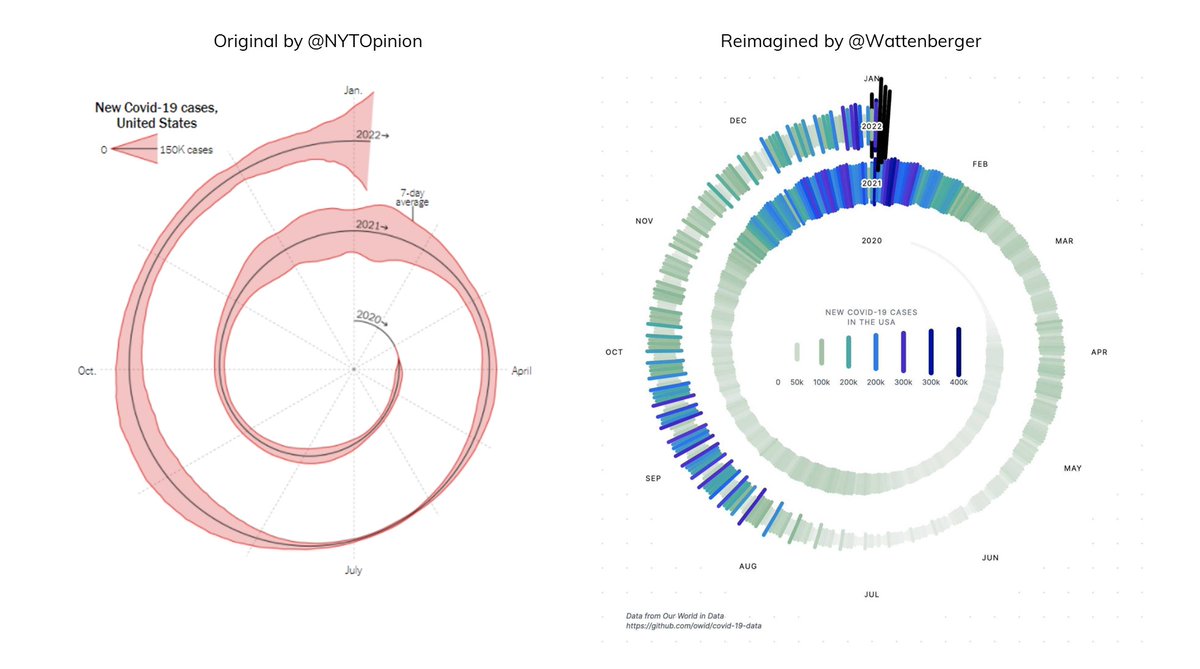
I was musing on why I love @Wattenberger's chart so much more than the original spiral graph (which I didn't have the disdain for that I saw from others).
Side-by-side, they showcase how seemingly-small design decisions have a big impact.
A few specific examples👇
@engineering_bae I'd (successfully) just finished a coding interview on the whiteboard....only for the interviewer to step back and dishearteningly point out a much, much simpler way to do it. Didn't hear back after that.
Definitely still have plenty to learn on this project, but at least it's a start!
Many thanks to the rad #postcards R package to get started: https://t.co/ZSTHXljccG
@d_olivaw@rstatstweet I sometimes use the interface if I'm lazy and don't want to dig up the file path, or if I'm importing something with a less common separator
If your choice of color palette is not color-blind friendly, color differences in a plot may not be obvious to color-blind people.
The {replacePlotColor} function from {colorBlindness} 📦 helps you replace colors with safe colors
https://t.co/AN9lyD9fpc
#rstats#DataScience
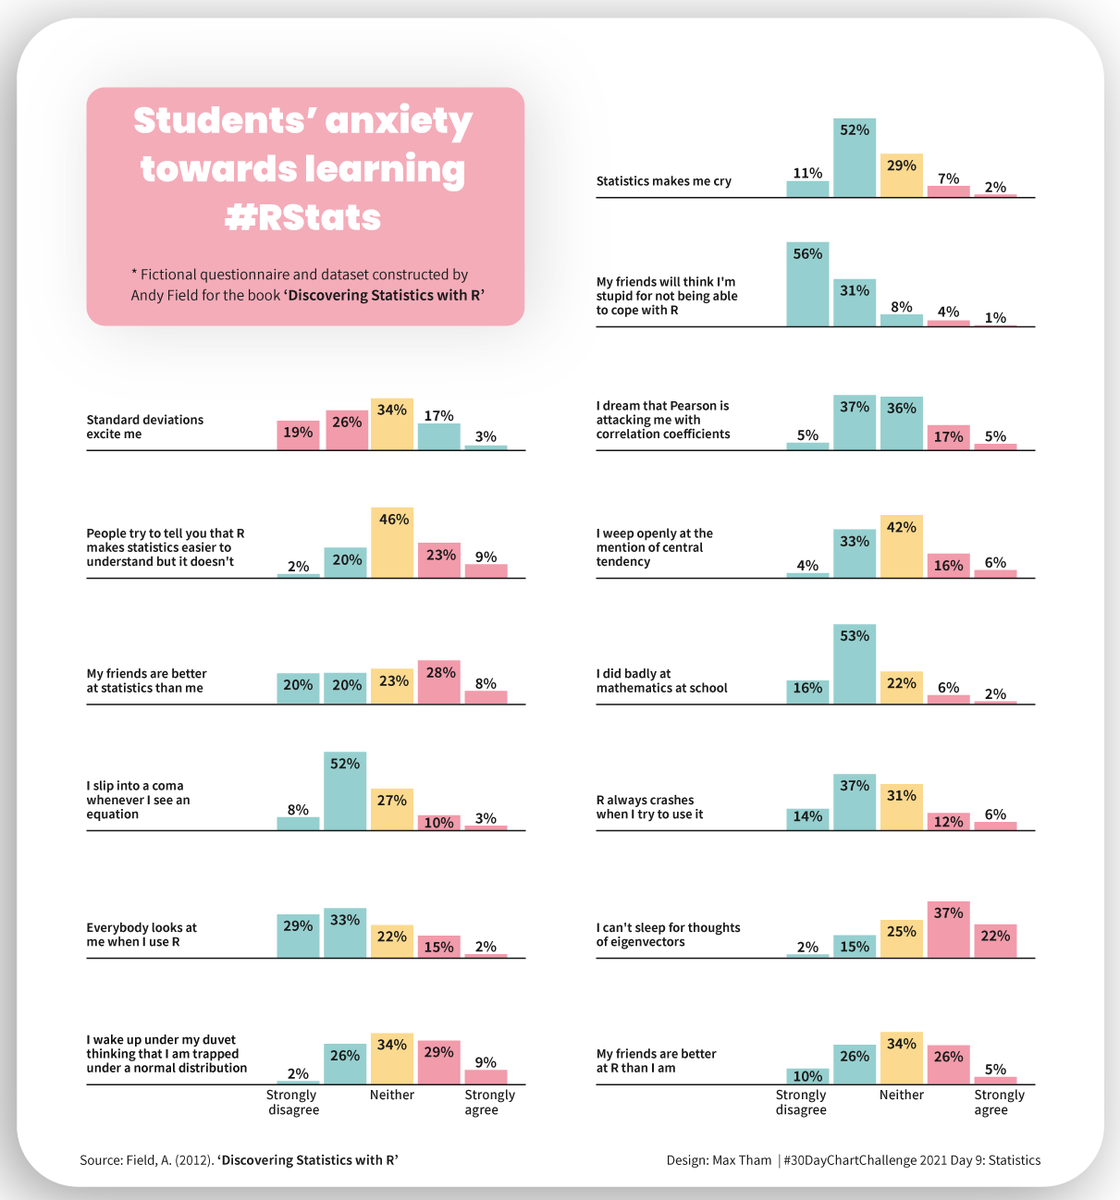
How anxious do students get when learning how to use #rstats?
For the #30DayChartChallenge Day 9 -statistics- I visualized the fictional questionnaire & dataset created by @ProfAndyField for his great stat book.
Tools: #ggplot2 for the base chart & #illustrator for styling