I have two private scripts that may help someone.
First one draws only the FVGs with high probability chance of being revisited. It seems to alternate between green and red.
Second one is iffy, it identifies liquidity draws. What I am noticing is that if there is a marked FVG below the liquidity level, it will go through it not just sweep it and reverse.
I need to study them more to find better relationship and how can I combine them to get better clearer view.
https://t.co/BPrUkKK2Rm
https://t.co/eambF0WgPX
Magic Hour Simulator is HERE!!!
Everyone posts winners.
Link MagicHour Simulator
https://t.co/w6vdkFVwJg
Nobody posts a simulator that counts its own failures.
So I built one.
SIM MagicHour trades the hourly range fade on your chart like a real position and shows you the full ledger. How many setups never filled and why. The break even rate your config needs before you risk a dollar. And it refuses to call anything profitable under 30 trades.
If it shows your setup loses money, it already paid for itself.
This is a BETA and this post stays pinned: reply with charts, broken fills, anything that executes wrong. Your reports build the next version.
The bigger plan: one honest simulator for every strategy, so you get real data on your edge without needing to know AI, coding, or backtesting. Just load it and read.
Free on TradingView.
Search SIM MagicHour NomadaScalper.
🟢 34 Day WINSTREAK 🔥 trading $NQ
smaller size cause of opex but i'll take a winning day
lots of confluences:
- PML Sweep, london low sweep
- 1 min inversion
- 1 min order block
- momentum
- monthly imbalance delivery
- daily volume imbalance / gap delivery
- in discount of the day
- singular gap
PS: I am doing a 4 week long bootcamp starting next week to teach these exact models that got me here trading fully live.
link in my bio. DO NOT MISS IT. Probably won't do another one till 2027.
If you're looking to pay for a simple trend indicator, you won't even need to.
If I see enough support in retweets, likes, and comments saying "I want it!", I'll make it completely public and free in a few days once I finish tweaking it.
This indicator is what kept me from making bad decisions with the magics every single time.
I promise you it’s built way better than the junk those scammers try to sell you.
I've been paid $1,000,000+ from prop firms, this is my simple strategy:
1) Trade during the NY AM session (9:30 - 11 AM)
2) Identify major levels of liquidity such as overnight highs and lows
3) Wait for one of these levels to sweep
4) On the lower time frames find a clean, singular FVG
5) When price closes above or below the FVG with good momentum, enter and target opposing liquidity
I trade this strategy every single day and have a 75%+ win rate 💰
MagicHour Edge just got an update.
Link https://t.co/5tgxs1Vr8r
You can now recolor every part of the range.
The box, the zones, the optimal band, the projected grid, the labels, all of it. Set it to match whatever your chart looks like.
The command panel also has a new Light theme if you run bright charts.
And if you turn off EMA confluence, the EMAs now disappear from the chart instead of sitting there. Cleaner when you don't need them.
The stats keep running the same underneath.
Same engine, same logic.
Just yours to style now.
I would appreciate RTs, likes, and please tell me in the comments what improvements you would like me to implement during the week.
Instead of buying @ApexTradeFund that doesnt pay, buy @LegendsTradingG its $12 for 1x50k EOD eval and $75 activation.
60% OFF + BOGO so add 2 to the cart its $24.
Use Code BUGATTI
https://t.co/jOkqj3EhWX
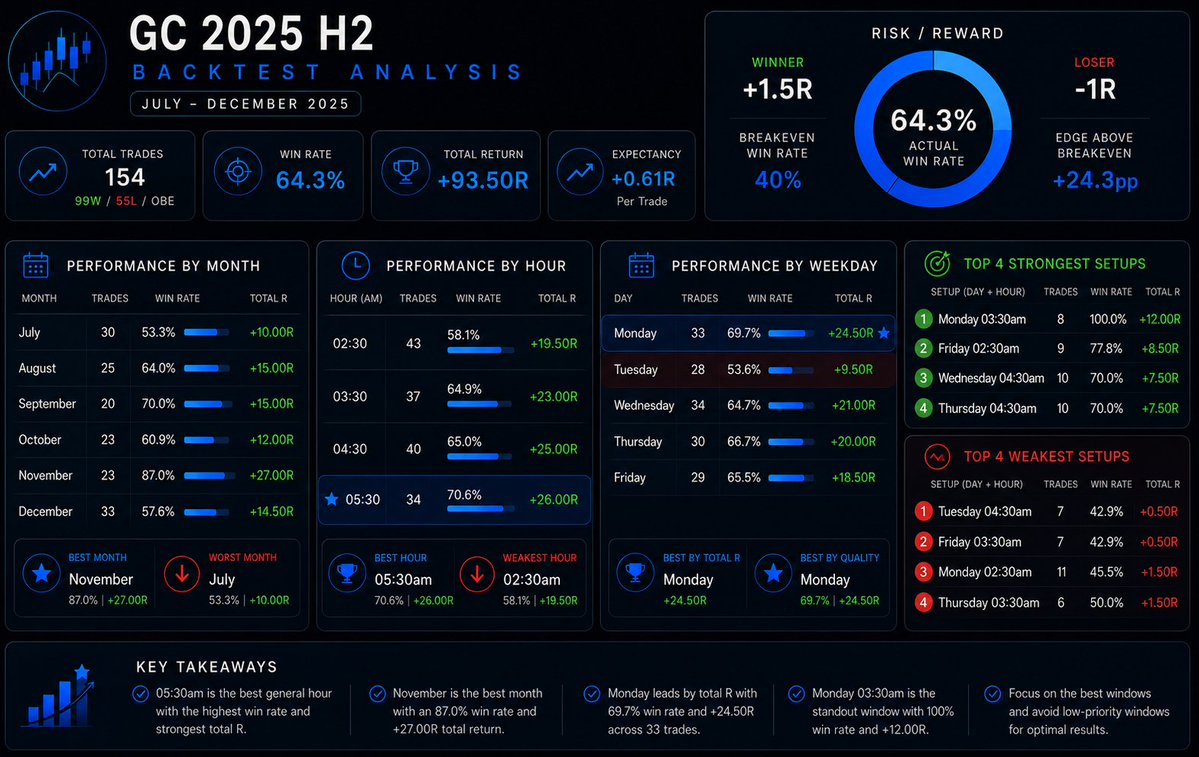
6 months. 154 trades.
I continued backtesting my $GC Mean Reversion model.
Jul–Dec 2025.
Results: 📈
+93.5R
64.3% win rate
-7R Max DD
The model is simple:
2:30am, 3:30am, 4:30am, 5:30am – Hourly Ranges
- Price deviates beyond the range
- 5m candle closes back inside
- Limit order at the range high/low
- Target 50% of the range
- Fixed 1.5R
The second half of the year came out on top. 🏆
- Higher win rate (64.3% vs 59.9%)
- More R despite fewer trades (+93.5R vs +88R)
Save this if you're planning to backtest it yourself.
2026 Coming next... 🔥
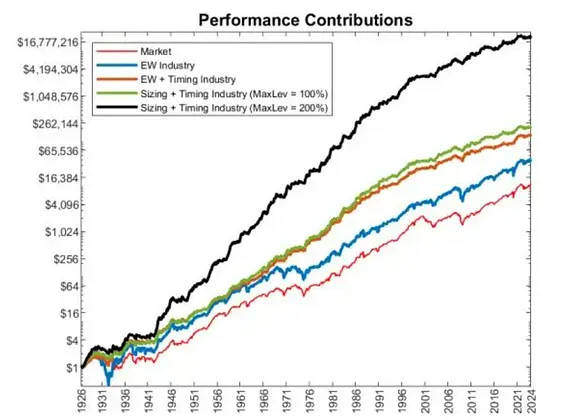
A Trend-Following Strategy With 18% Annual Returns Since 1926
A recent research paper, A Century of Profitable Industry Trends, by Carlo Zarattini and Gary Antonacci, shows that a simple trend-following strategy applied to industry portfolios has delivered strong long-term results.
The idea is straightforward: buy industries that break out to new highs, manage risk through volatility-adjusted position sizing, and exit when the trend weakens.
According to the paper, this approach generated about 18% annualized returns from 1926 onward across 48 industry portfolios, while also producing strong risk-adjusted performance.
Trading Rules
The strategy identifies trends using basic breakout signals.
A long position is opened when an industry closes above the upper band of either a Donchian Channel or a Keltner Channel.
For the Donchian Channel, the upper band is based on the highest close over the previous 20 trading days. The lower band uses a longer 40-day lookback period.
This asymmetry is important. It allows the system to enter trends relatively quickly, but gives winning positions more room to continue before forcing an exit.
The Keltner Channel uses a 20-day exponential moving average plus a volatility buffer of 1.4 times the Average True Range. Like the Donchian exit, the lower Keltner band is based on a 40-day lookback.
The strategy is long-only. If no industries show a valid upward trend, the portfolio moves into Treasury bills instead of staying invested in equities.
Risk Management
Risk is controlled through volatility targeting.
Each industry position is sized so that it contributes roughly the same amount of risk to the portfolio. In practice, this means industries with higher recent volatility receive smaller allocations, while less volatile industries receive larger allocations.
The position sizing is based on 14-day volatility.
To keep the strategy realistic, total portfolio exposure is capped at 200%.
Exits are handled with a trailing stop. The stop is defined as the higher of the lower Donchian band and the lower Keltner band, both using a 40-day lookback.
Once the stop moves higher, it is never lowered. This helps the strategy stay with strong trends while still cutting losing trades when momentum fades.
Results
The results are impressive. The paper reports annualized returns of around 18% since 1926 across a broad set of industry portfolios.
This is a good reminder that trend following does not have to be complicated. Simple breakout rules, combined with position sizing and disciplined exits, can be surprisingly robust over very long periods.
For anyone interested in trend following, industry rotation, or long-term systematic trading, I strongly recommend reading the original research paper.