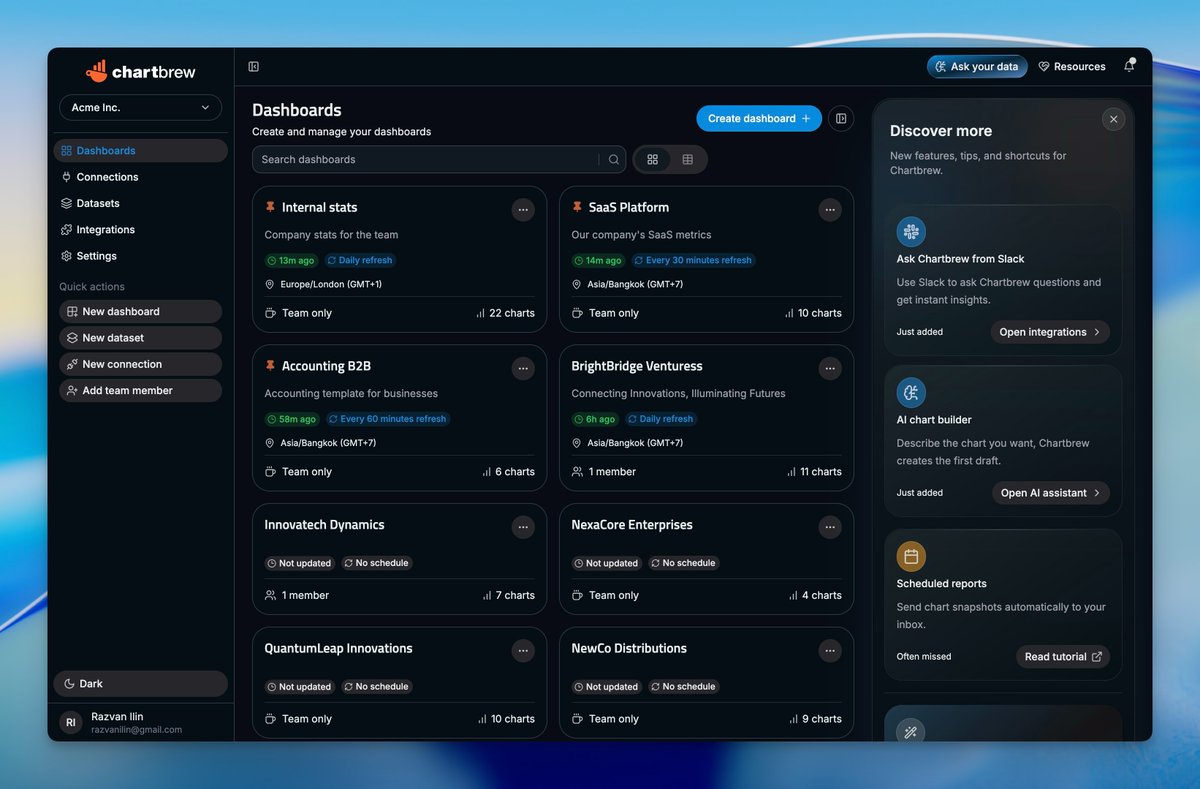
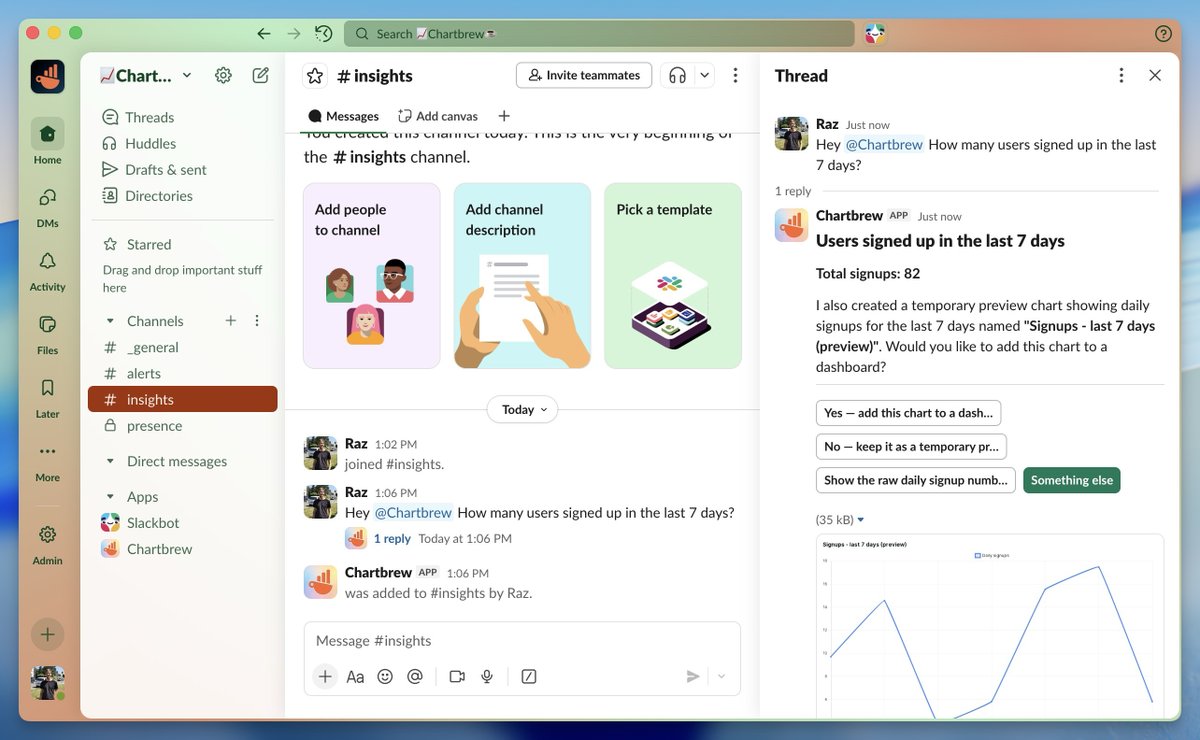
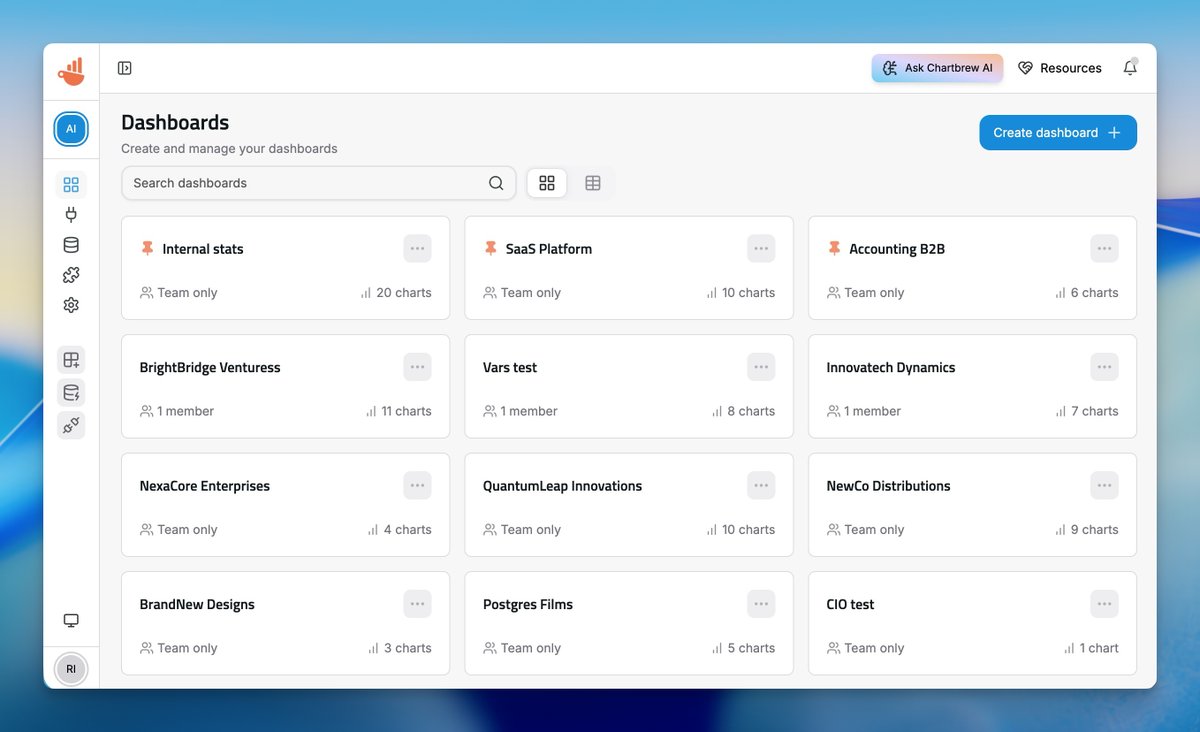
Shipped a really fun update for Chartbrew 🙌 A @SlackHQ bot you can talk to
It can answer questions from all the data sources you have connected to Chartbrew. It can even create chart snapshots and datasets on the fly
You like the chart? Add it to your reports from Slack 🤓
Just shipped Chartbrew AI to production! 🚀
The AI assistant can be launched from anywhere in the app to help gather insights, create datasets, and add charts to reports
Lots to add and improve, but hopefully I can gather some feedback to go in the right direction 🤞
WIP 🚧
I've been working on integrating an assistant with @chartbrew for the past couple of days
This demo shows me asking about my data and then instructing the AI to create a chart and place it in one of my dashboards. So many possibilities! 😁
Shipped a new update for the @strapijs plugin 🚢
It was hard to maintain the custom chart components to mimic the look and feel of the ones in Chartbrew, so now the plugin uses iframes.
You can now bring full reports to your Strapi dashboard 🤓
Just shipped the auto-layout feature for @chartbrew to make it easier to tidy up the dashboards.
In Chartbrew, you can set up a specific layout for each screen type, but that can be a pain when maintaining dashboards.
So I hope this auto-layout option can help 🤓
The new ClickHouse HTTP Interface for Tinybird allows you to connect your BI tools, ORMs, and language clients directly to Tinybird without any extra plugins or workarounds.
Here's a list of all the cool new things you can now natively connect to Tinybird 👇
Build o11y dashboards with @grafana
Explore your data with @_hex_tech
Build dashboards with @apachesuperset
Ask data questions with @metabase
Edit SQL with @dbeaver_news
Query from your IDE with @datagrip
Visualize with @getredash
Generate live charts with @chartbrew
Build notebooks with @DeepnoteHQ
Create dashboards with @getdraxlr
Generate AI insights with @hqfabi
Share reports with @holistics_bi
Embed charts with @luzmo_official
Find documentation for all these connections in the official Tinybird ClickHouse interface docs: https://t.co/mccbEYwN7h
Finally shipped the new variable system in @chartbrew 🎉
It was one of those features that changed some of the fundamentals of the entire application, so it required quite a bit of time to implement
This is a demo of how the SQL editor works with variables
Chartbrew v4 is out now! I'll leave some links below to the blog and release notes
Notable changes:
📸 Dashboard snapshots on email and Slack
🎛️ Updated dashboard filters
✨ Updated design
📝 Switched to FSL + MIT license for OS
💁 Trial can be extended to 30 days now
Chartbrew @chartbrew — Create stunning data visualizations with ease
⭐ Stars: 2,804
🔗 Forks: 338
⏩ Last commit: 2 days ago
⌛ First commit: 6 years ago
https://t.co/j9ZVTHBUdX
Just released all the stuff I've been working on lately for Chartbrew for the self-hosting folks 🎉
✨ Added gauge charts
✨ Introduced markdown widget
✨ Added table view for MongoDB query results
✨ Can now duplicate datasets and connections
https://t.co/MJODUzHDb2
I've been working on text widgets for Chartbrew and it's been quite a tricky one to get right 😮💨
✅ Added staging step for changes
✅ Text widget needs to fit right on all screen sizes
✅ Drag-n-drop not interfere with the text editor
✅ Fix all 45345 grid layout edge-cases
Just shipped the first of the many AI features I have in plan for @chartbrew 🙌
The first one is a conversation-style sql query builder. You can ask Chartbrew to create and adjust queries for you. It works with all the SQL-based connections on the platform
Chartbrew v3.10.0, freshly brewed ☕️
The new version comes with an easier way to share and build reports, a new documentation site, API reference, and lots more.
Full changelog: https://t.co/cws2zVIFIL