BIG UPDATE 38 YEARS OF DATA NOW
Updated my NYC Summer Rain Dashboard with 38 years of data.
Here's everything new:
📊 Data & Facts
• 38 summers analyzed (1988–2025), not just recent years
• Weekends were rainier in only 18 of 38 years — it flips every decade
• 2009 is the all-time worst: 59% of weekends soaked
• 2014 is the all-time best: only 20% of weekends rained
• Longest rainy streak: 9 consecutive weekends (2023)
• Longest annual run: weekdays dominated 6 straight years (2003–2008)
• Weekend rain is trending up +0.08%/yr over 38 years
• Friday rains 43.6% of the time — worst day of the week
• August dumps the most rain per day; June is the driest month
• ~$120M lost in outdoor dining revenue every summer from weekend rain
🔬 The Science
• There's a peer-reviewed explanation (Cerveny & Balling, Nature 1998)
• Weekday traffic/industry loads the air with aerosols Mon–Thu
• By Friday they seed clouds → weekend rain
• Effect is strongest in Atlanta (+4.1pp), real in Boston/Philly/DC, weak in Chicago, nonexistent in LA
🛠️ New Features
• Animated year-by-year race (watch 38 summers unfold)
• Compare any two years head-to-head
• GitHub-style rain calendar (every single summer day)
• 38-year heatmap grid
• Streak tracker
• Decade-by-decade breakdown
• City comparison chart
• Linear trend analysis with regression line
• Monthly breakdown (June vs July vs August)
NYC weekends really do feel rainier... I ran more data and built a full data investigation to see if the pattern is real.
Across 2,192 days (6yrs now!) of weather data, NYC rain rates by day of week look like this:
Mon: 27.8%
Tue: 32.9%
Wed: 31.8%
Thu: 34.5%
Fri: 38.0%
Sat: 35.8%
Sun: 32.3%
Friday is the rainiest day of the week.
You are not imagining it.
The interesting part is the possible chain reaction behind it.
NYC’s PM2.5 air pollution appears to peak midweek, with Wednesday averaging 8.5 µg/m³, roughly 23% higher than Sunday’s 6.9.
Those particles can act as cloud condensation nuclei, which may help clouds form and intensify under the right atmospheric conditions.
With a 2–3 day lag, that points to a plausible pattern:
Midweek pollution buildup → late-week cloud formation → Friday/Saturday rain risk.
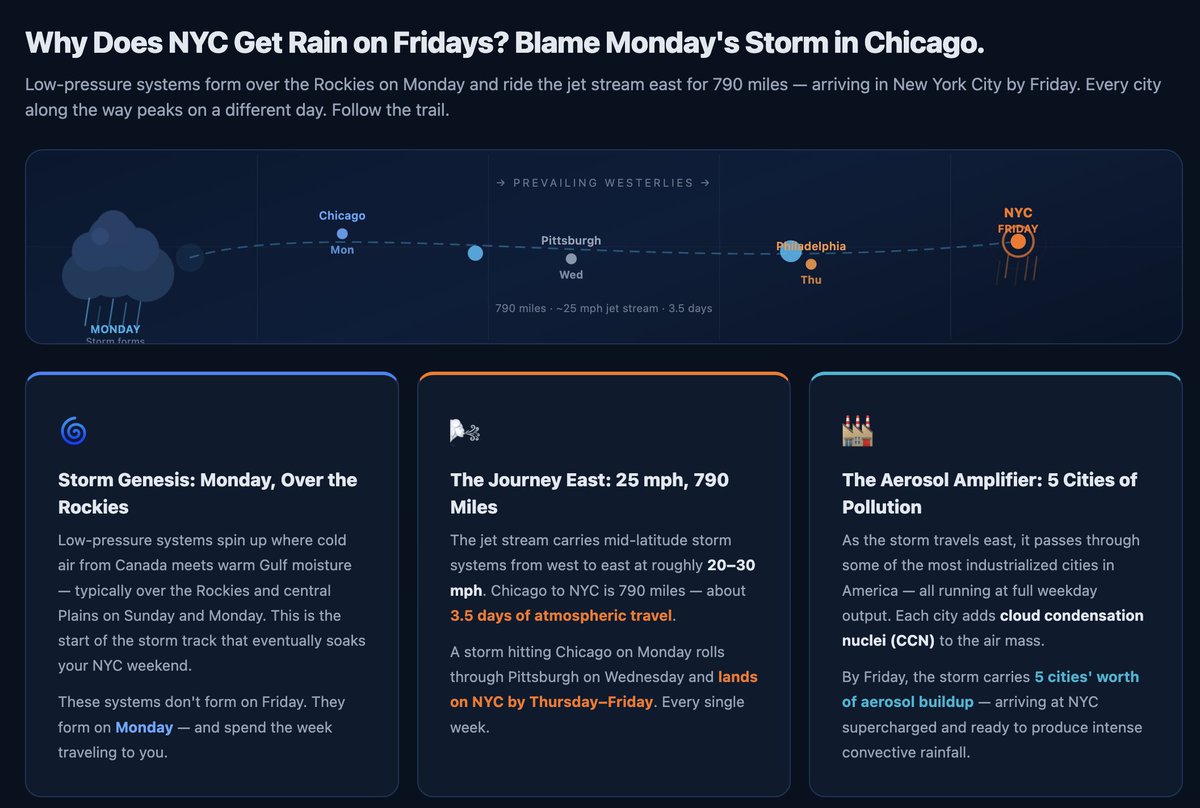
But the weather does not start in NYC.
Storm systems often form or organize farther west, then move east with the prevailing flow. In the data, the rain pattern appears to travel city by city:
Chicago: Mon, 33.2%
Pittsburgh: Wed, 34.1%
Philadelphia: Thu, 35.2%
NYC: Fri, 38.0%
The storm track takes roughly 3.5 days to travel about 790 miles.
Which means it can arrive in New York right as the weekend begins.
NYC also is not only dealing with its own emissions. A meaningful share of its PM2.5 can come from upwind sources.
The I-95 corridor, including Philly, Trenton, Newark, and surrounding metro areas, sits directly southwest of NYC, which matters because prevailing winds often move pollution northeast.
In other words, NYC may be the end of the pipeline.
One of the most interesting signals came from COVID.
During lockdowns, the weekly pollution rhythm weakened sharply as traffic collapsed. With far fewer vehicle crossings and less commuter activity, the normal 7-day aerosol cycle became much less pronounced.
When traffic came back, the pattern returned.
That does not prove tailpipes alone are making it rain every weekend. Weather is complicated. But the data suggests a real and testable relationship between traffic, pollution, atmospheric particles, storm timing, and late-week rainfall.
The thesis:
Our weekly human activity cycle may be helping shape NYC’s weekly rain cycle.
Full interactive dashboard with 2,192 days of data, animated storm tracks, and live charts:
https://t.co/m4dpRvXoXo
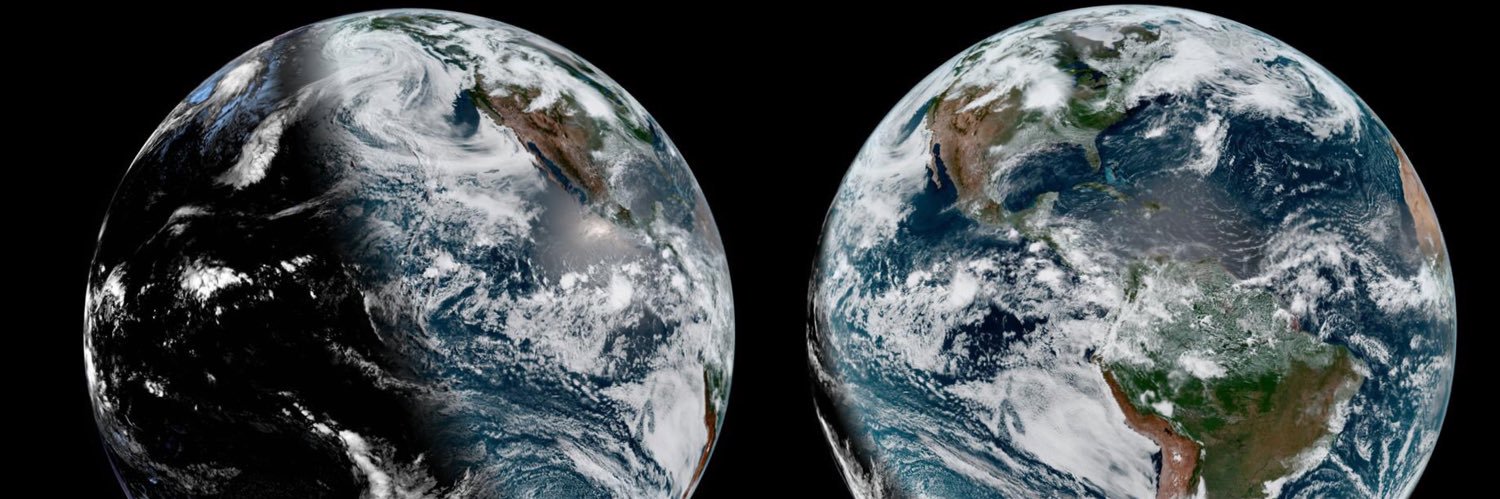
Since 1900, humans have cleared 1.1 billion hectares of forest.
This is a comparison between the pre-industrial forests and the current ones.
[🎞️ globaia]
The sun came up in Utqiagvik, Alaska — the northernmost city in the U.S. — on Sunday morning and it won't set again until August 2. Timelapse footage from the National Weather Service shows the sun setting at 1:48 a.m. before rising above the horizon at 2:57 a.m.
The Fibonacci sequence (0,1,1,2,3,5,8,13…) isn’t just math — it’s a universal pattern. As it grows, ratios of terms approach the Golden Ratio (Φ ≈1.618), a harmony found in spirals, plants, shells, galaxies & even DNA.
[🎞️ thevisualalchemy]
Comparing latitudes in the same hemisphere, then flipping the world to show the antipodes and comparing latitudes in opposite hemisphere. Work by neilrkaye
SLS vs. Saturn V, a real time comparison.
Saw a comparison yesterday using my video on the left at 50% speed. Here's a proper comparison with both rockets launching at their real speeds.
You'll notice SLS is significantly faster off the pad because of the dual massive SRBs!
Orion’s crew and service module have separated. The crew module continues on its path towards Earth while the service module will harmlessly burn up in Earth’s atmosphere over the Pacific Ocean. The Artemis II return trajectory is designed to ensure any remaining debris does not pose a hazard to land, people, or shipping lanes.
We're going farther than ever before 🚀
Today, the Artemis II crew will break the record for how far humans have traveled from Earth as they fly around the far side of the Moon.
Coverage begins at 1 p.m. EDT (1700 UTC). Watch Artemis II make history: https://t.co/G7LpghURjg
Liftoff.
The Artemis II mission launched from @NASAKennedy at 6:35pm ET (2235 UTC), propelling four astronauts on a journey around the Moon.
Artemis II will pave the way for future Moon landings, as well as the next giant leap — astronauts on Mars.
It’s the Spring Equinox—astronomical spring begins today. Meteorological spring started March 1.
Learn why they’re different: https://t.co/rRWaknryeV
How do YOU mark spring?