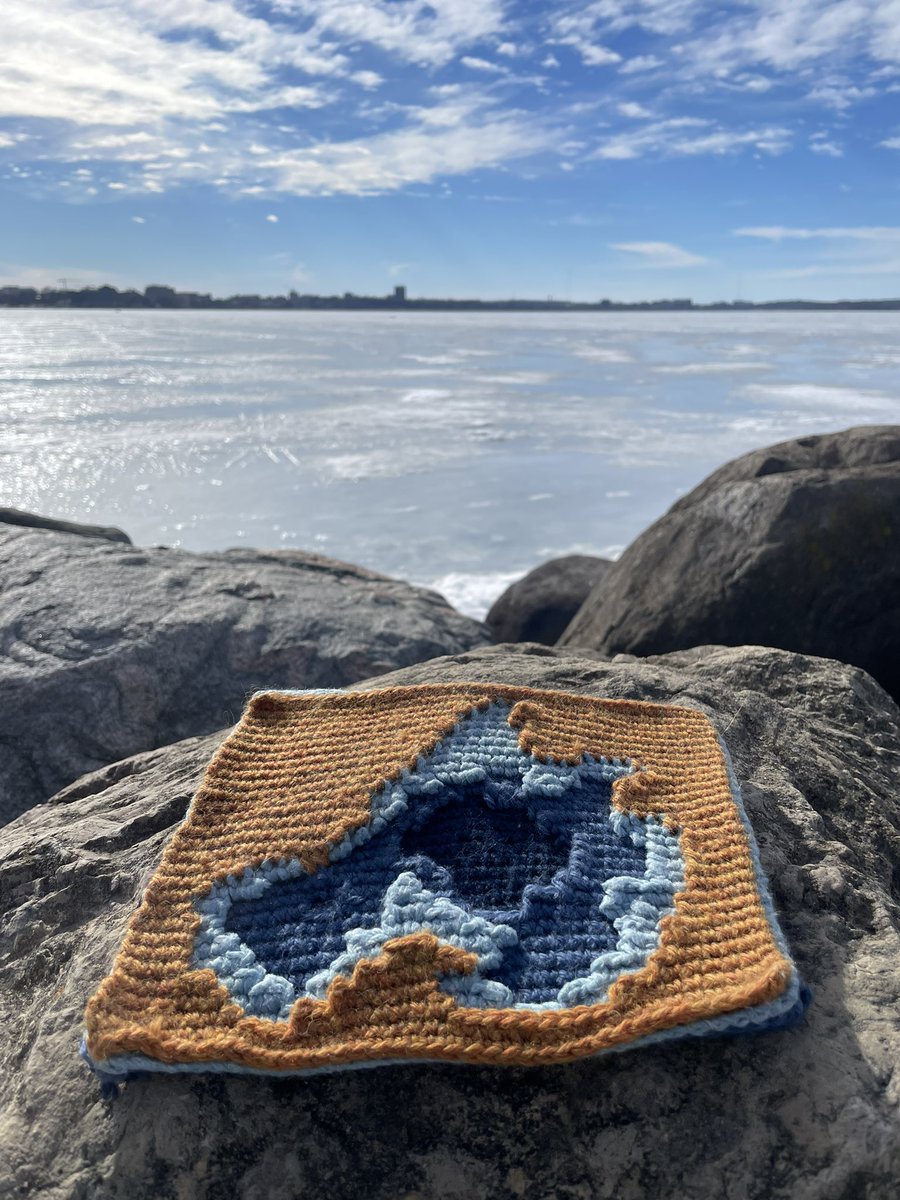
Been a little obsessed lately with mapping in crochet. Here’s bathymetry for Lake Mendota in worsted weight wool and acrylic. Each stitch roughly equals 300 sq meters, and each layer represents a depth change of 10 meters. #gischat
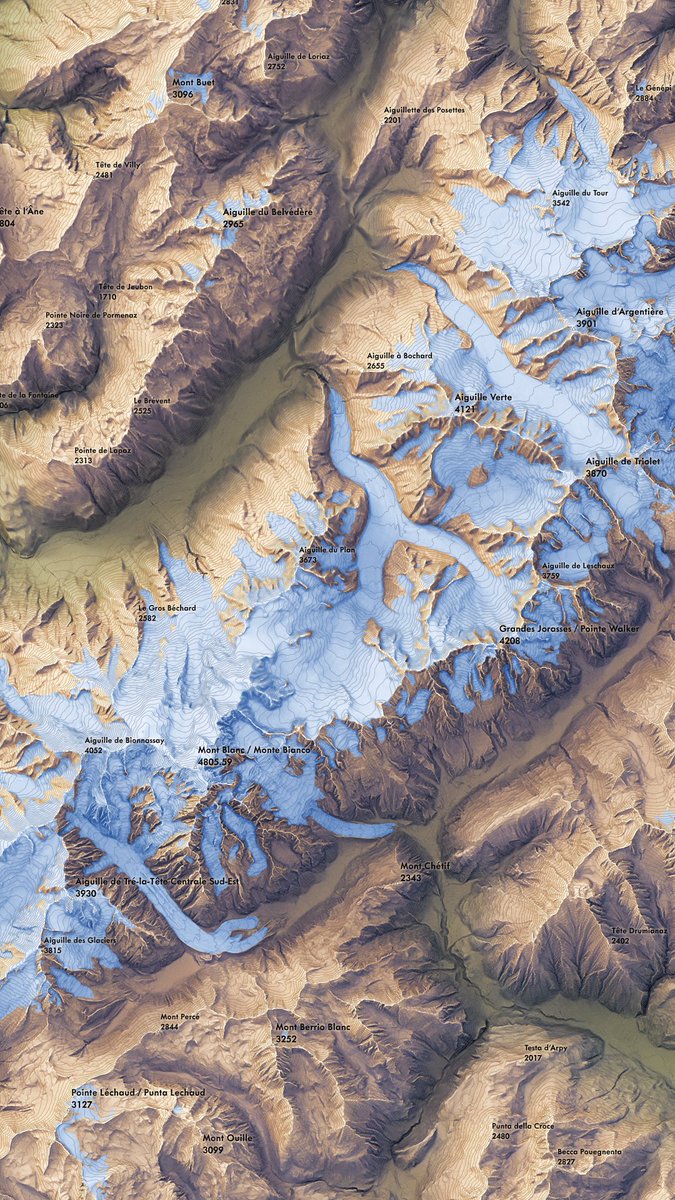
#30DayMapChallenge Day 5: A Journey / Day 7: Vintage Style
I solemnly swear that I am up to no good.
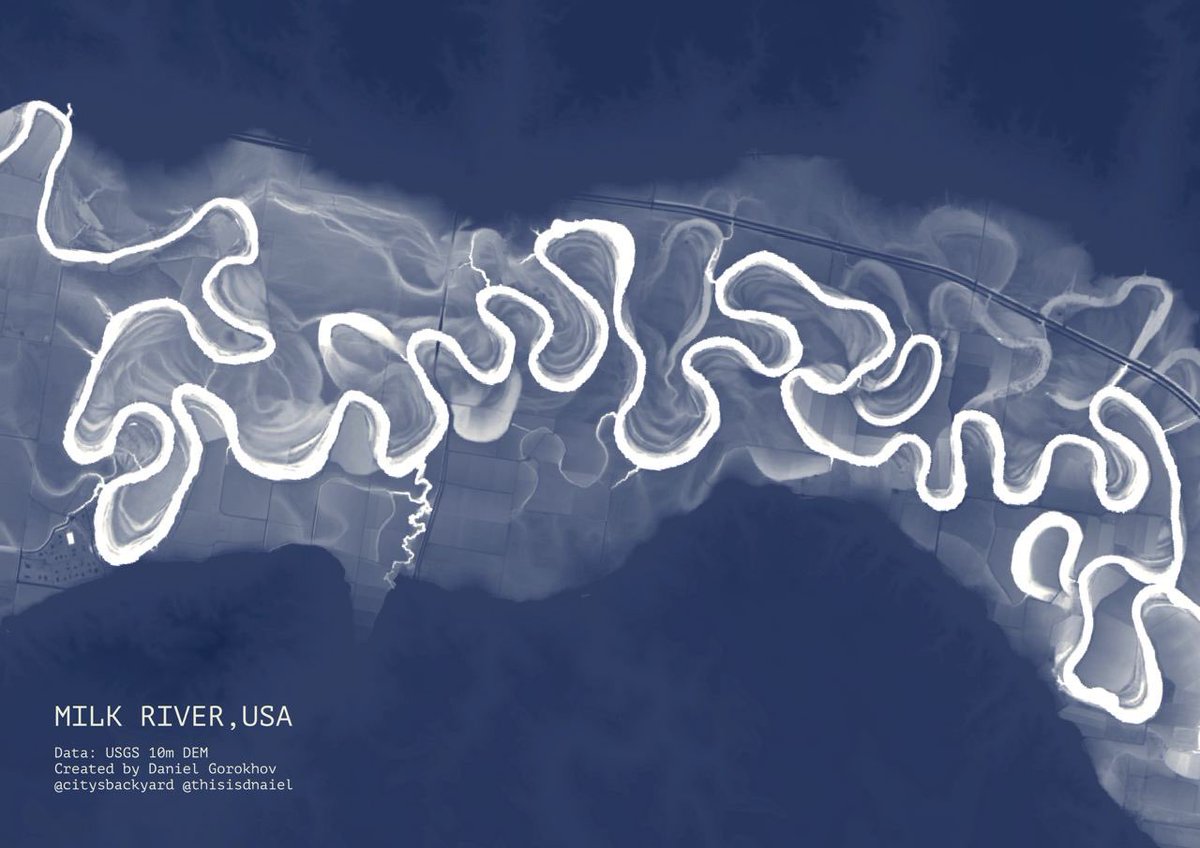
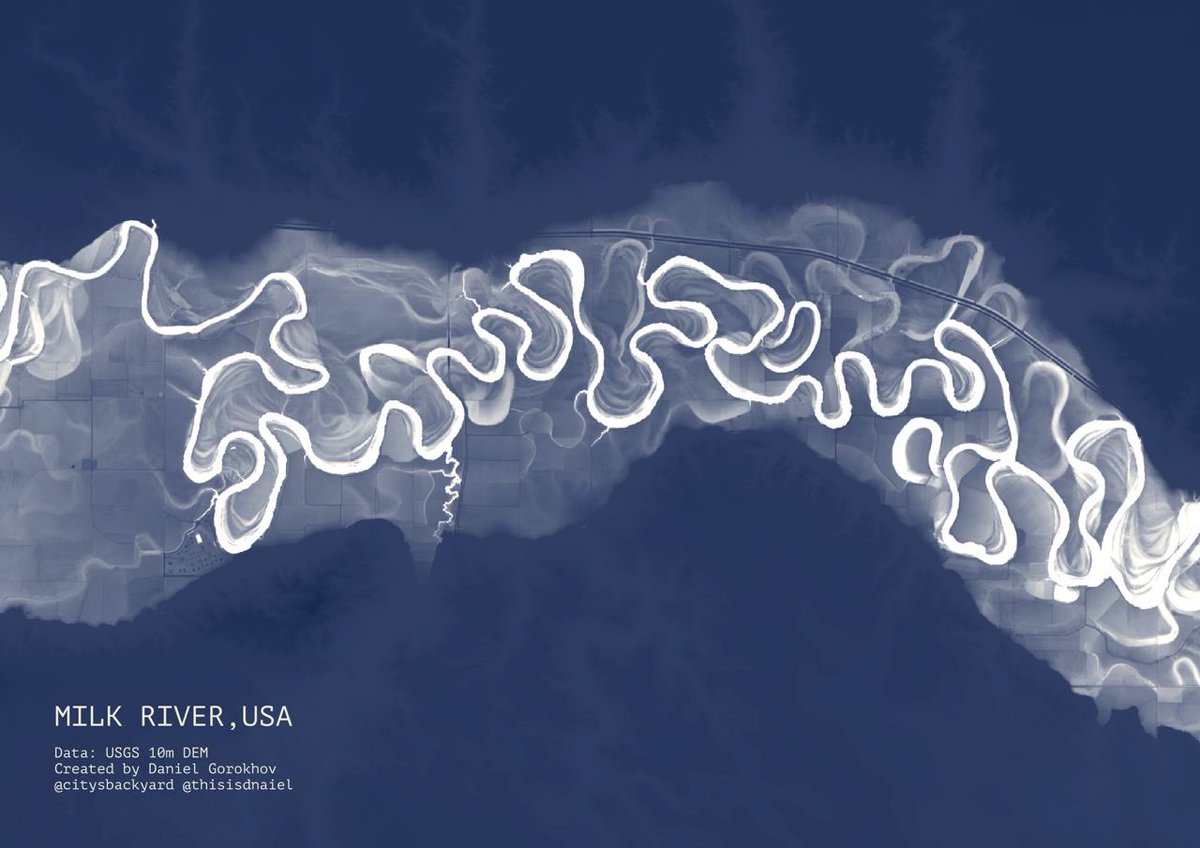
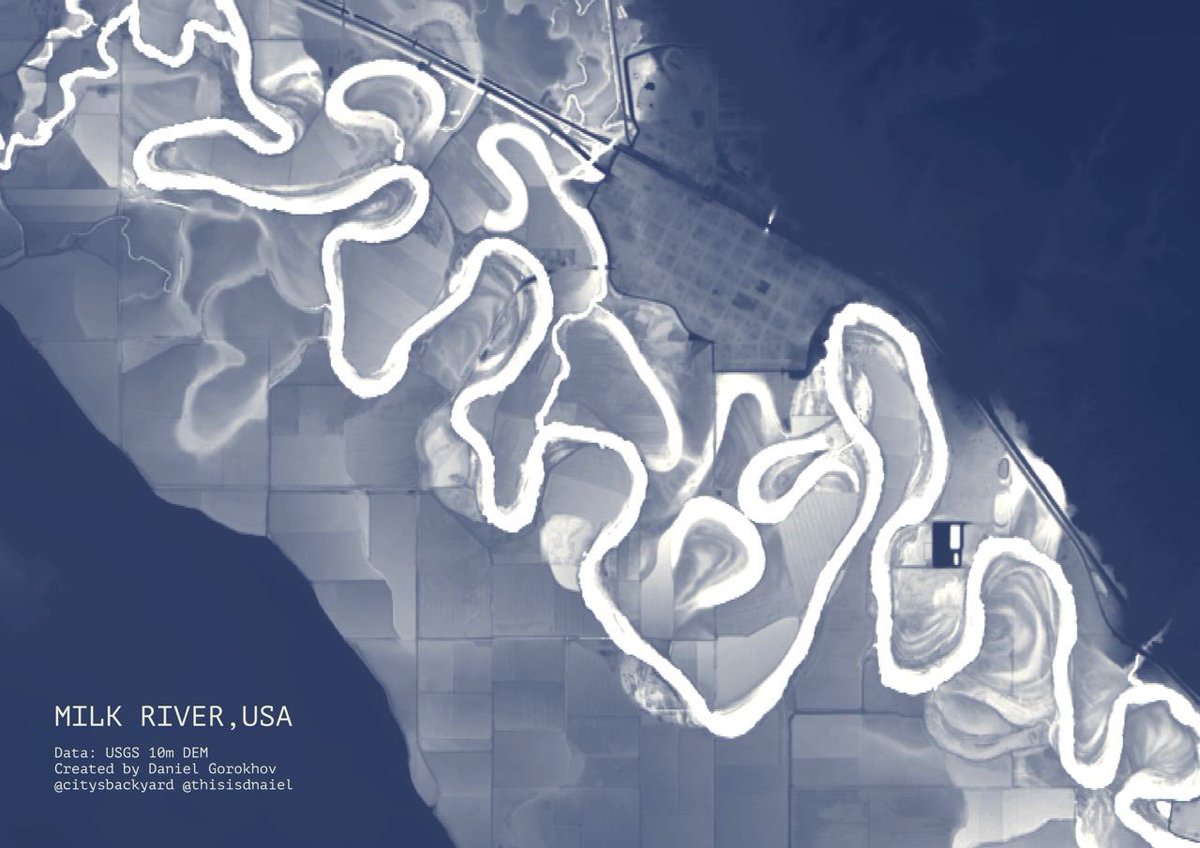
Dumbledore taking a stroll through Milano. See here: https://t.co/A95Ns2LJ5h
Built on @willy_maps's code + own style based on @mzdraper Pencil style
#builtwithmapbox@Mapbox
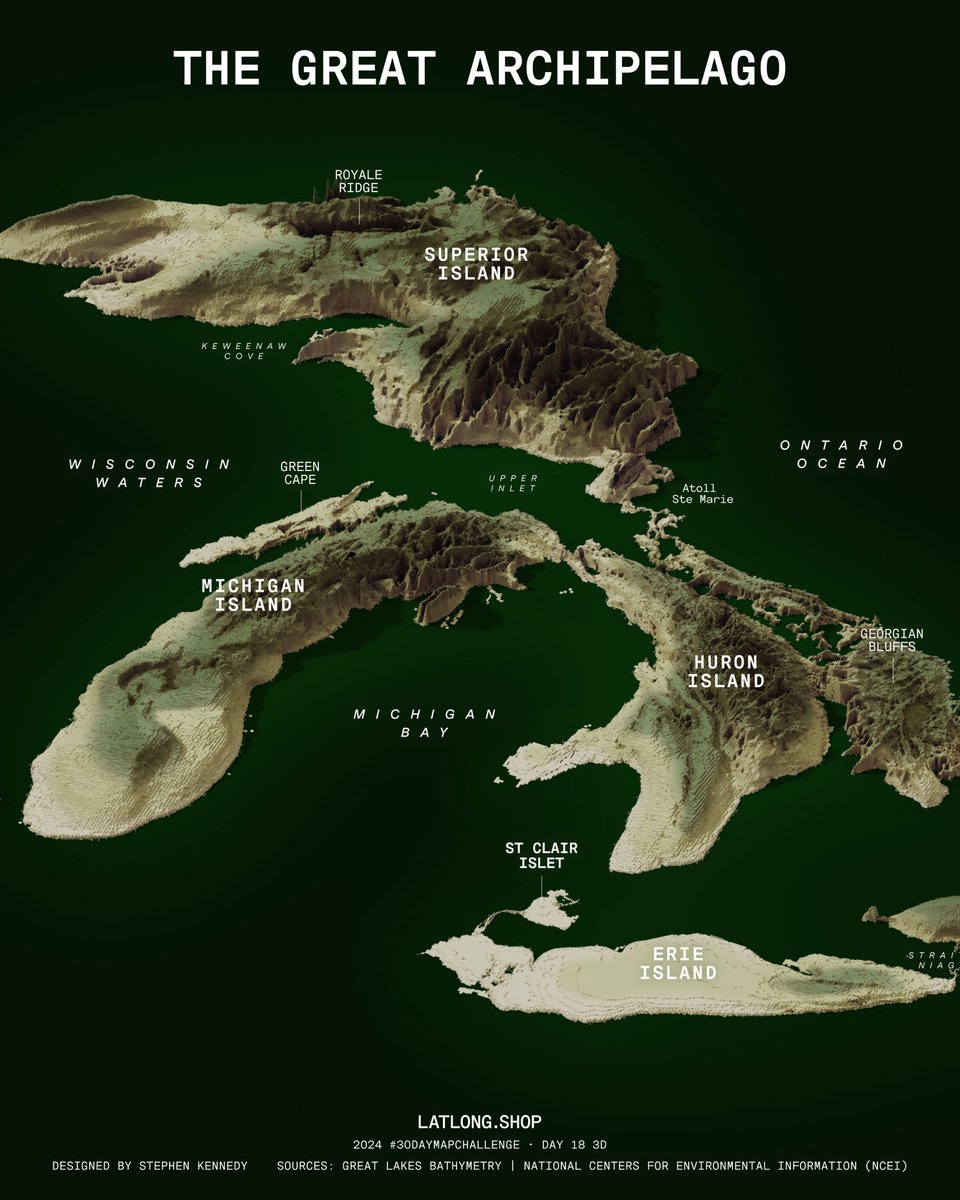
#30DayMapChallenge | Day 18 3D | The Great Archipelago
Inverted bathymetry map of the Great Lakes represented as a chain of islands.
Hoping to work more on rendering and styling after the challenge. And taking any land or water feature naming suggestions! #greatlakes#map
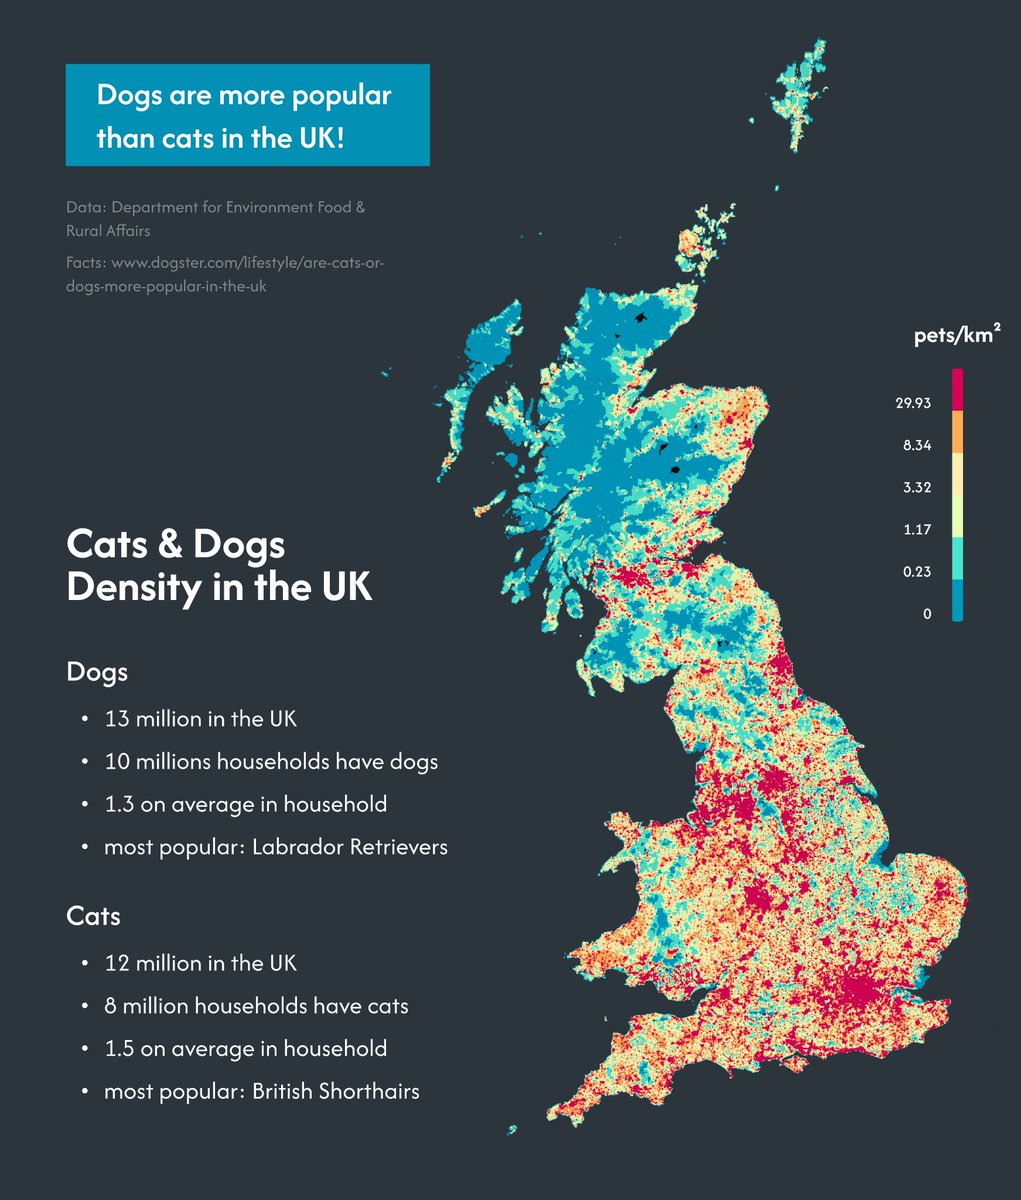
#30DayMapChallenge Day 6: Raster - Dogs & Cats density in the UK 🐕
I wanted to know what is the distribution of cats and dogs somewhere in the world. Luckily, found a dataset for the UK. Not obvious, but dogs here are more popular than cats!
#30DayMapChallenge Day 11: Arctic
One year of MODIS daily mosaic images
Did you know optical satellites usually don’t capture data over the poles in winter due to lack of sunlight? The "no data" hole grows as we near the winter solstice, and starts closing once daylight returns
#30DayMapChallenge | Day 10 Pen & Paper | Paper Towns 📝
Places significant to Wisconsin’s burgeoning paper industry, including towns that developed around mills from the late 19th to early 20th C, supported by the state’s abundant hardwood forests + power-generating rivers.
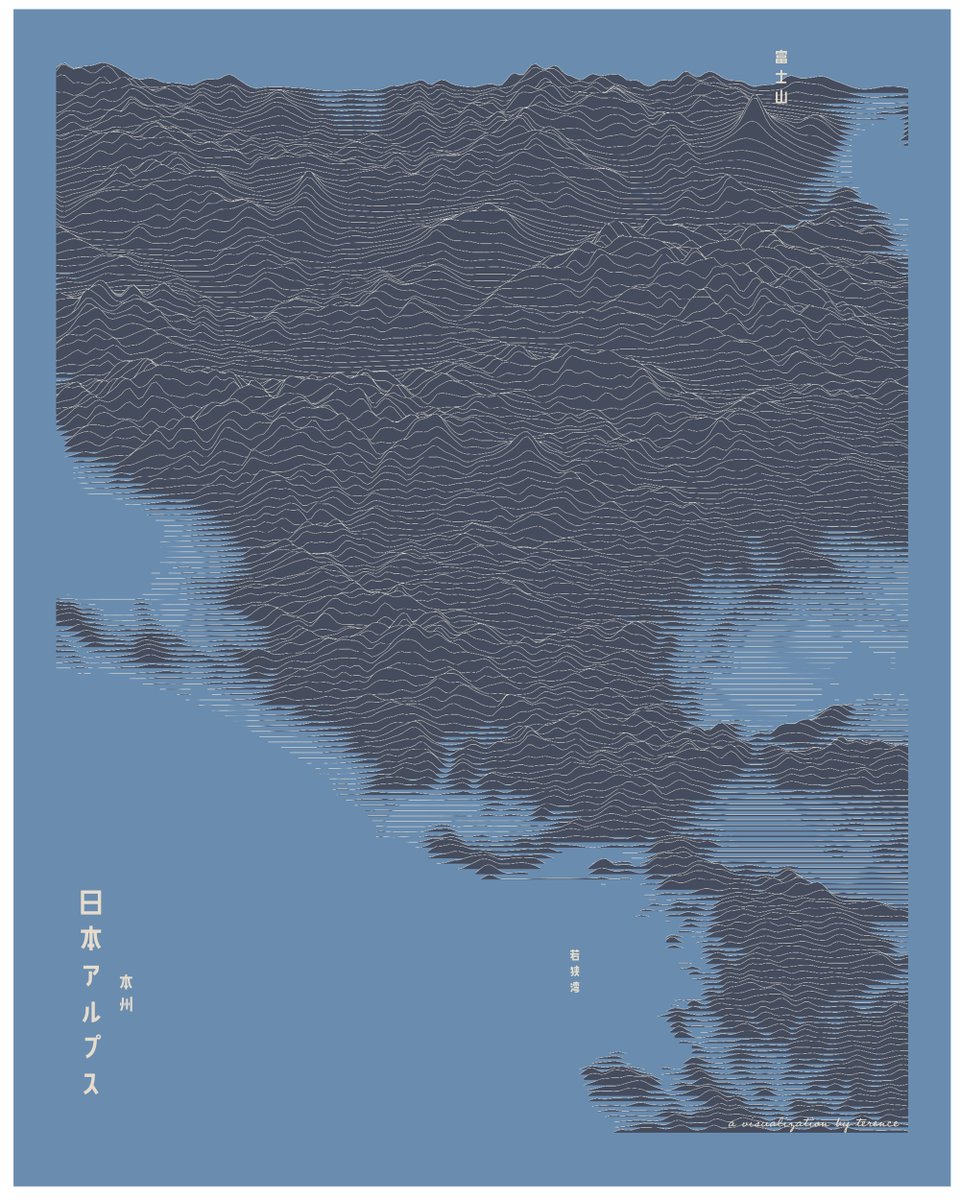
Taking a break from #30DayMapChallenge with a ridgeline plot of the Japanese Alps. I rather like how Mount Fuji stands out, like a signpost to help me figure out where's what.
Inspired and made possible by @jjakon11#ggridges adventures, an #rstats tale
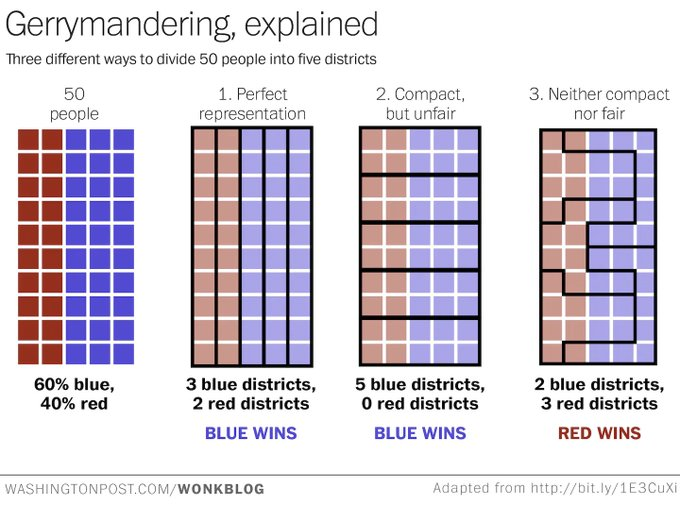
One important geospatial concept has a MASSIVE impact on election results.
It's called the Modifiable Areal Unit Problem.
Here’s what you need to know about it:
#30DayMapChallenge | Day 6 Raster | Crop Rotations
10 years of rotation between corn, soy, and alfalfa across Dane County. Farmers rotate between crops to keep the soil healthy, reduce pests, and increase yields.
Raster bands extracted from @USDA CropScape dataset.
Sorry @NASA_Landsat, I know this is not how you've imagined the usage, but I just can't help making comebacks with 'Your name in Landsat' tool because they look ✨ b e a u t i f u l✨
#geospatial#mappymemes#gischat
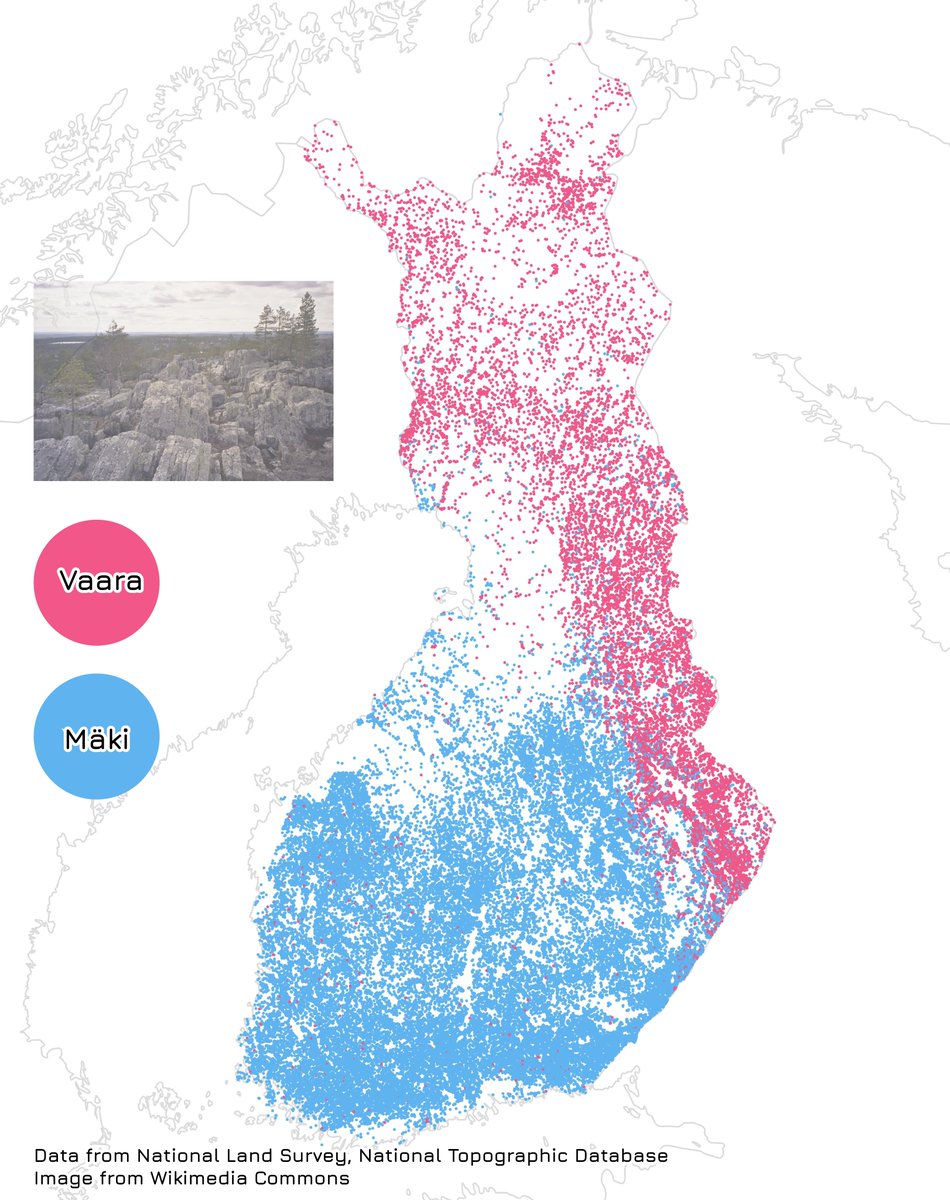
#30DayMapChallenge | Day 1 | Points
How hills are called in different parts of Finland? Map shows all place names from @Maanmittaus ending with either 'vaara' or 'mäki'
#30DayMapChallenge Day 4 — Hexagons
Today’s highlight is “Crystal Cities” by Mapbox map designer Stephen Kennedy. This map uses the Kontur Population hex grid dataset to visualize population density stylized as glowing crystal forms.
Explore how data brings cities to life: https://t.co/wI1lsmqxFv
#BuiltWithMapbox #Data