If you've been exploring @duckdb, you've likely used the read_csv function to examine a CSV file. It's a great tool that swiftly gets you to the core but you also get sniff_csv to see the parameters that will be inferred for you.
DuckDB v1.1.0 was released this Monday with friendly SQL improvements, performance optimizations and GeoParquet support.
For a detailed rundown of the new features, see Mark Raasveldt's presentation from DuckCon #5.
@timmolendijk@duckdb@ApacheParquet Maybe you want to try DatalakeStudio, a visual app for loading, querying and ploting data. With DuckDb, Mosaic graphs, Mapbox, H3, etc
Since quak is based on the @uwdata Mosaic architecture, it supports environments beyond @ProjectJupyter. The demo site let's you profile tables entirely in the browser, backed by @duckdb WASM. It can also be wired up to @motherduck.
👉 https://t.co/AgvhmgAHN4
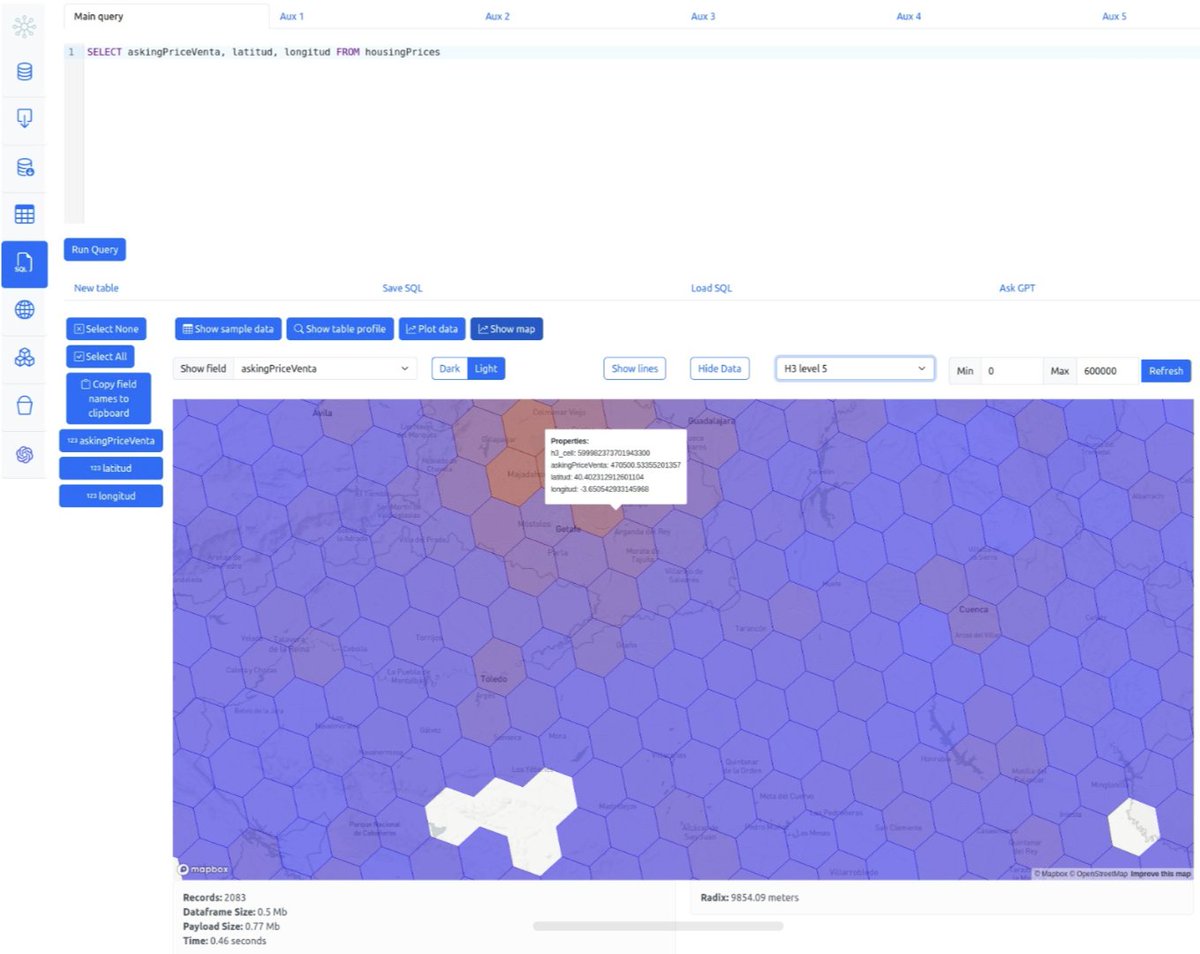
Now DatalakeStudio allows you to visualize H3 summaries of your data. H3 hexagons are generated in real time in milliseconds thanks to @duckdb and the awesome H3 extension of @IsaacBrodsky
Now DatalakeStudio allows you to visualize H3 summaries of your data. H3 hexagons are generated in real time in milliseconds thanks to @duckdb and the awesome H3 extension of @IsaacBrodsky