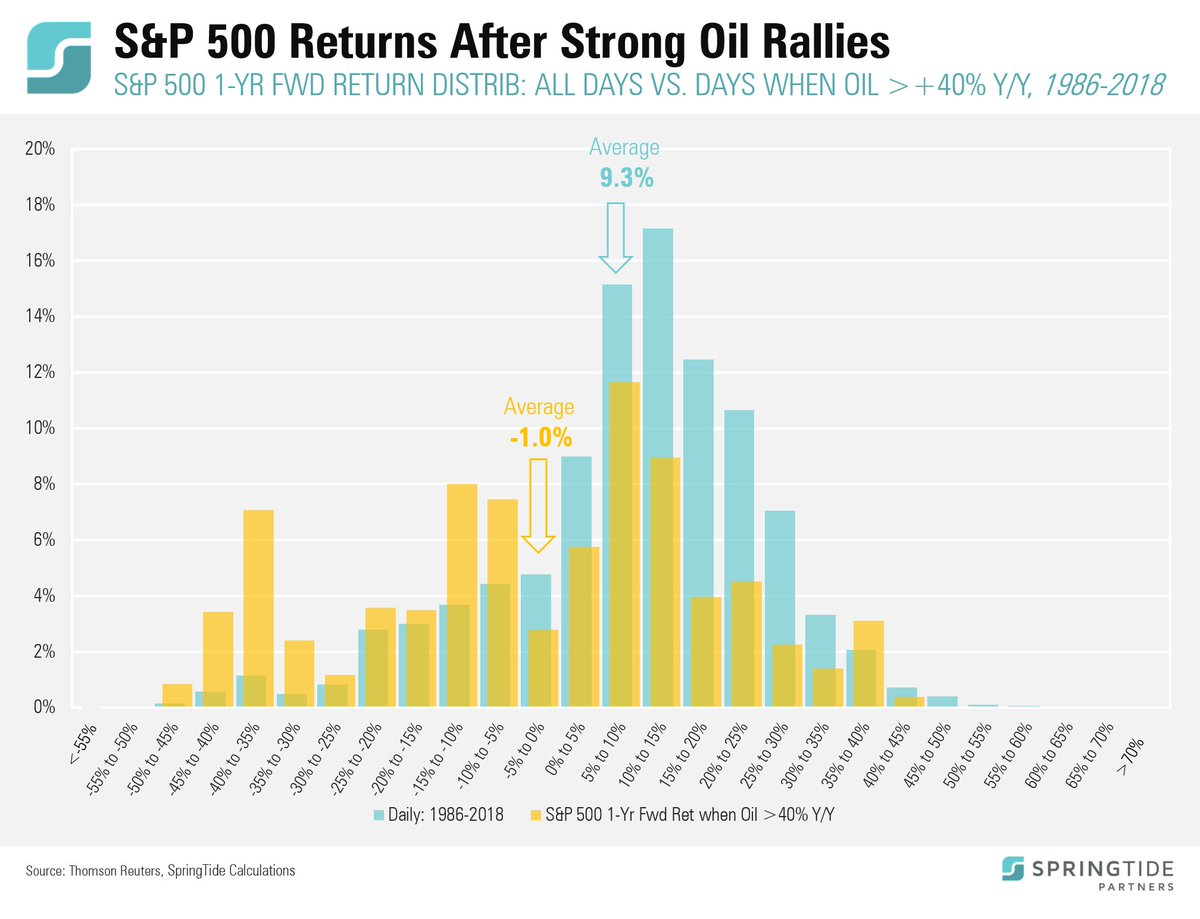
ICYMI: This week's chart compared 1-yr fwd returns for U.S. stocks for all days since '86 (teal bars) to just those days when oil had rallied >40% in prior yr (yellow). The 10.3% spread suggests jumps in oil prices may be a significant headwind for stocks. https://t.co/kfBD6uiFHY
ICYMI: Record High Faith in the Fed! This week's #SpringTideCOTW looks at the record low spread between Treasury implied inflation rates of different maturities.
(link: https://t.co/tz1nUg248B)
In 2017, more than 75% of IPOs had negative earnings--the highest percentage since the peak of the Dot-Com Bubble in 2000. #SpringTideCOTW
link: https://t.co/ceF3pMAlKu
From the SpringTide blog: How's your balance sheet? Why we believe the worst asset class of the last nine years may be the most helpful going forward. Link: https://t.co/kiZ2soGsNd
From the SpringTide blog: Comments from our roundtable discussion with @RealRickRule , @JohnFMauldin & Chris Casey of Windrock Wealth. Topics covered included the dollar, emerging markets, Treasury supply, North Korea & cryptocurrencies.
Link: https://t.co/Clw3GFBmZl
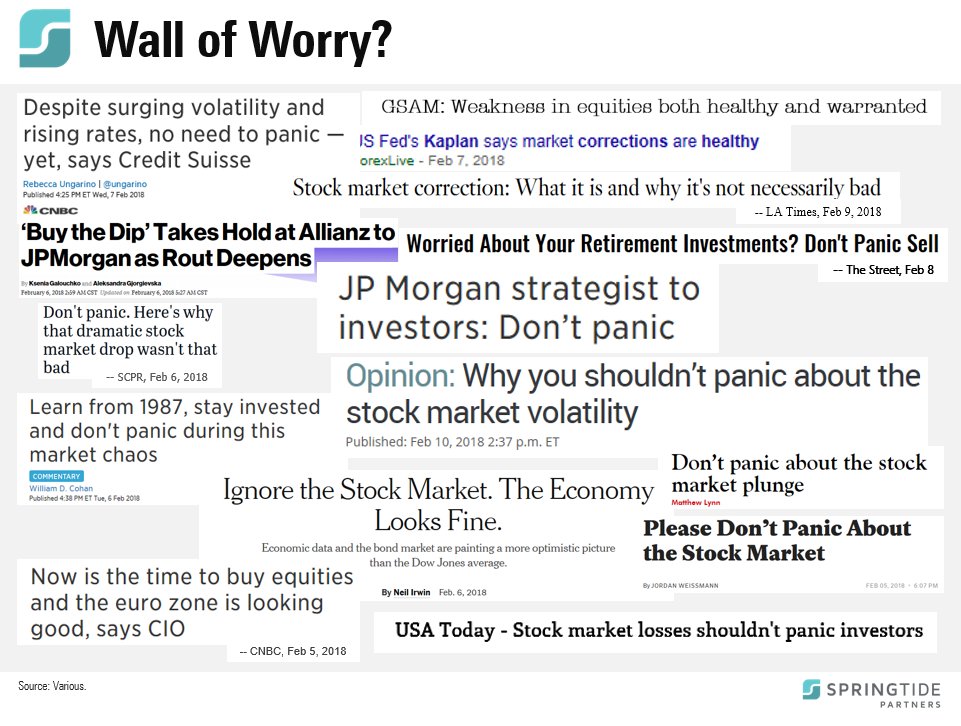
From the blog: Don't Panic -- why we would like to see a little more concern before we get interested in adding to U.S. stocks. Link: https://t.co/dUjl1DwpBA
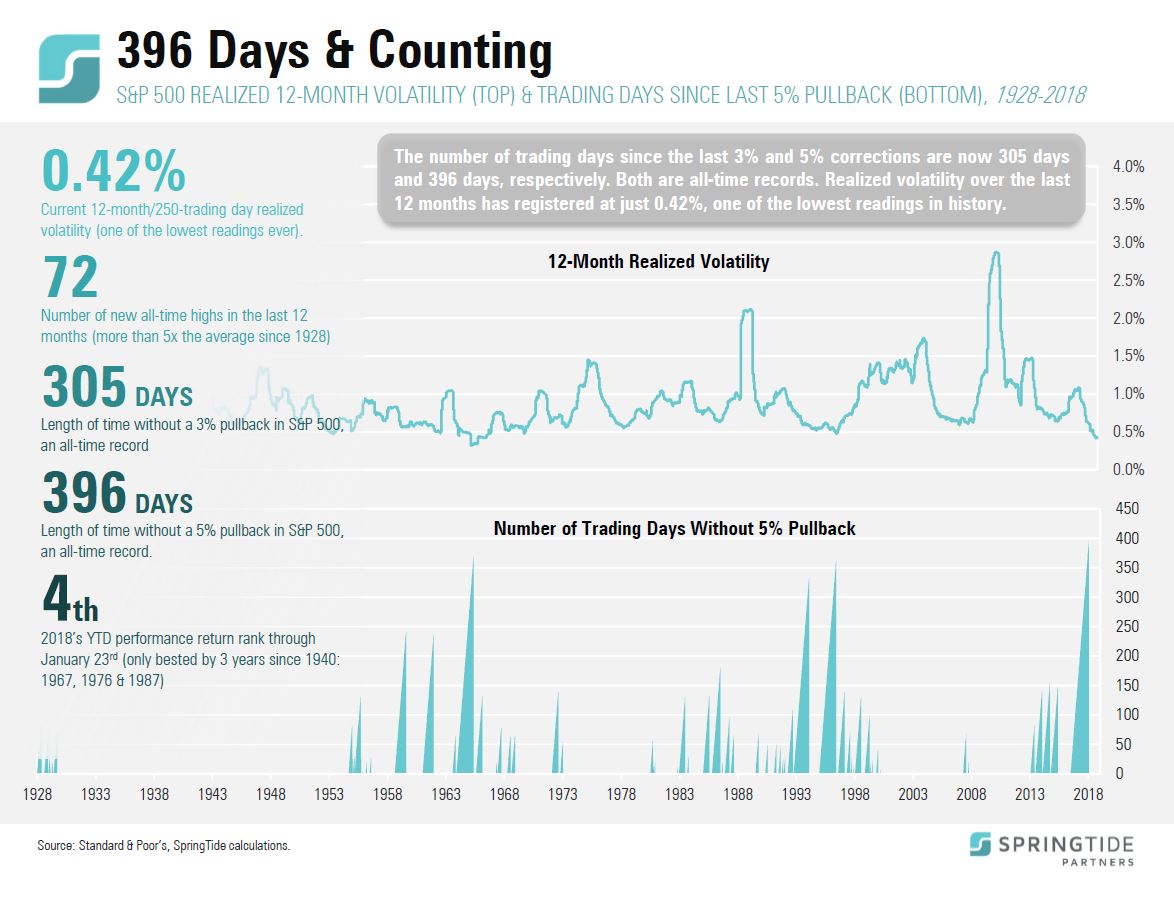
Yesterday two bubbles burst: the first was the tulip bubble and the second was the bubble in complacency (low volatility). As fate would have it, February 5th was the 381st anniversary of the peak of the tulip bubble in the Dutch Republic...
Read more: https://t.co/eNfJnFMeIi
Our chart of the week compares 1-yr fwd returns for every day since 1928 to a subset of days that are similar to today: historically expensive in a strong y/y up-trend >30%. #SpringTideCOTW - https://t.co/6KqZWFBgDO