🇯🇵 El Banco Central de Japón ya es dueño del 52% de toda la deuda pública del país. Más de 4 billones de dólares.
Y aun así los tipos de interés del bono a 30 años acaban de marcar máximo histórico: por encima del 4%.
Cuando el mayor comprador del mercado no puede contener los precios, el mensaje es claro: algo se está rompiendo.
✔️ Vamos a explicarlo desde una perspectiva de mercados y emisiones de deuda…
¿Cómo calculamos la volatilidad implícita de las opciones? La respuesta a eso cambió.
Cualquiera que haya armado un Excel o programa para valuar por Black-Scholes, o se haya puesto a revisar las fórmulas detrás de la planilla, se habrá dado cuenta de que mientras existe una fórmula cerrada para el precio de las opciones y para las griegas, a la hora de calcular la volatilidad implícita hay que optimizar: usar solver, un script en VBA o una función que encuentre numéricamente la volatilidad implícita que resuelva la fórmula con el resto de inputs conocidos.
Esto pasa porque Black-Scholes va para un solo lado. Le metés VI, strike, spot, tasa y tiempo, y te devuelve el precio. Pero en la práctica vos tenés el precio que ves en pantalla y querés saber a qué VI opera. Y para eso, durante 50 años, no quedó otra que iterar: tirar un valor, ver qué precio da, ajustar, volver a probar. Newton-Raphson, bisección, el Solver de Excel, etc.
Hace unas semanas salió un paper que parece resolver esto con una fórmula cerrada. Sale hilo 👇
(1/5)
Te lo imprimes y te cuelgas delante del ordenador…
Antes de entrar mira si has definido todo el proceso… así consigues operar alineado con el HTF.
Puedes variar algo las relaciones, pero poco.
Si crees que este post te aporta se agradece ❤️ y 🔄
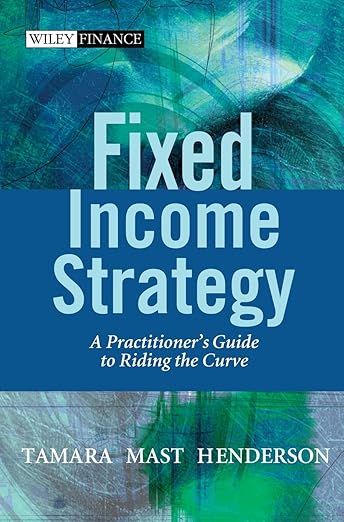
Reuní en un solo lugar los cursos, papers y libros que conforman el marco que uso todos los días, para que puedas construir el tuyo.
Espero que estos materiales le sean útiles.
https://t.co/or3Oqkzo1i
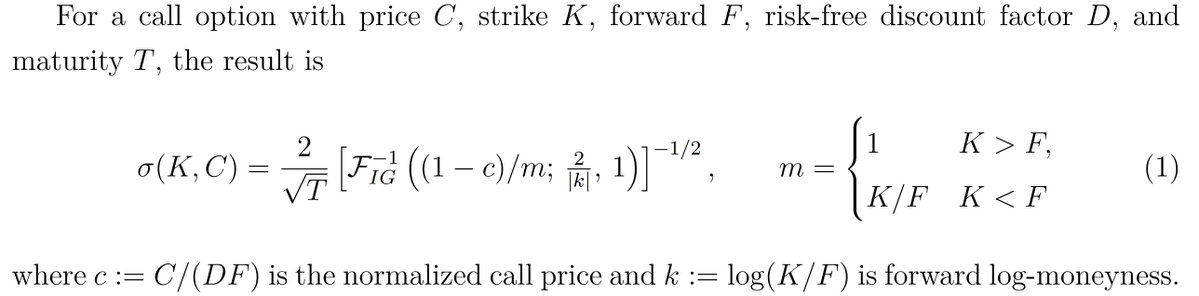
Wolfgang Schadner, a Swiss quant, found the closed formula for the direct inversion of Black & Scholes option implied volatility !
Everyone has been using root search for ~50 years and his formula is fast.
More elegant result, as no boundaries or starting value are required. You still need somewhat of a root search in the inverse Gaussian quantile, or use a smart approximation ;)
Then it is down to single digit microseconds.
https://t.co/gZV1aJ7OLa
Me he entretenido hoy a construir el pipeline para equity research.
El informe cubre resumen ejecutivo, modelo de negocio, rendimiento histórico a 10 años, calidad financiera (la sección más densa: márgenes, balance, FCF, retornos sobre capital), contexto macroeconómico, riesgo cuantitativo y análisis técnico, estructura accionarial y asignación de capital, valoración con múltiples modelos de fair value, comparativa con peers del sector, y escenarios alcistas y bajistas con fuentes verificables del 10-K, 8-K y noticias recientes.
11 agentes LLM orquestados haciendo sliding context entre secciones, placeholders para 385 campos inyectados (si el dato no está en el prompt, no existe), una capa que audita el informe completo contra los datos de referencia, y guardrails deterministas en post-processing.
11 secciones, 14 gráficos interactivos, datos de 5 fuentes públicas.
Producto que se enmarca dentro del servicio de suscripción mensual y que además se vende como informe bajo demanda: elige tu fondo (ISIN) o acción (ticker), y recibes el análisis completo. Packs desde 3€/informe.
Tenéis el informe de muestra en la web:
▶️ https://t.co/JJqTXYgFBb
🚨Tu Mac está llena de mierda invisible que te come RAM y espacio… y CleanMyMac te cobra un montón de plata por hacer lo que hace [MOLE] GRATIS y 10x mejor.
Y HOY LANZARON LA v1.31.0 “Makima”
→ Escaneos 10x más rápidos (limpia +27 GB en segundos).
→ Nueva alerta de procesos que te queman la CPU (¡te avisa en tiempo real!).
→ Limpieza profunda + purga de Docker, Xcode, node_modules y más.
→ Todo en un solo binario (no bloatware).
(También hay una versión experimental para Windows)
REPOOO👇
@aaronjmars I have translated the repo and output if it helps: https://t.co/SiVXOlFBLK + added support for claude subs
Have you found the result helpful?
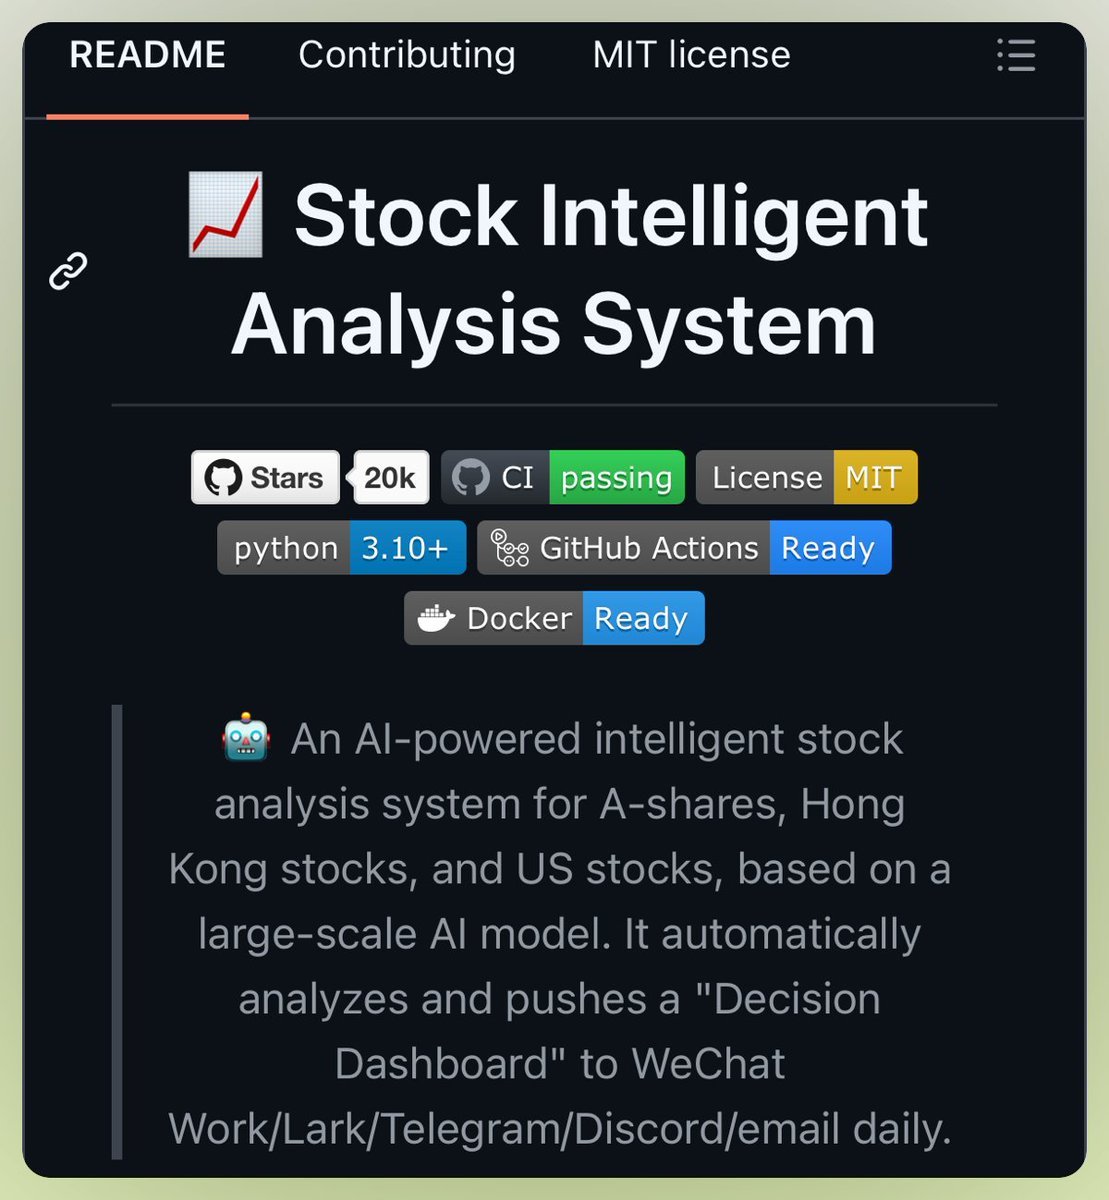
🚨 Wall Street analysts charge $500/hour for stock research. Someone just automated the entire job for free.
It's called daily_stock_analysis.
You give it your stock list. Every single day it collects market data, reads the latest news, runs everything through AI, and sends you a full decision report.
Not alerts. Not charts. A complete buy/sell/hold verdict with exact prices.
Here's what it does on autopilot:
→ Pulls live market data from 4 different sources
→ Scrapes real-time financial news
→ Feeds everything into Gemini or DeepSeek
→ Generates a decision dashboard for each stock
→ Gives you exact entry price, stop loss, and target price
→ Flags dangerous stocks that are too overextended to buy
→ Sends the full report to Telegram, email, Slack, or Discord
Here's the wildest part:
It runs on GitHub Actions. That means zero server. Zero cost. You fork the repo, add your stock list, drop in a free Gemini API key, and it runs every weekday at 6 PM automatically. Forever. For free.
This is the kind of daily brief hedge fund interns spend 4 hours building every morning.
It takes one fork and five minutes to set up.
711 GitHub stars. Pure Python. MIT License.
100% Open Source.
My professor kicked me out of a statistics lecture for arguing with him.
"Markets can't be measured with entropy."
He was wrong.
Every contract on Polymarket leaks information. And there's one equation that measures exactly how much:
H = −Σ pᵢ · log₂(pᵢ)
Shannon Entropy. The same math that tells your phone how to compress a photo - tells me which markets are mispriced.
A market at 50/50 has maximum entropy: 1.0 bit. Pure uncertainty. No edge.
A market at 90/10 has entropy of 0.47 bits. The crowd already knows something. Hard to beat.
But the sweet spot? Markets between 25¢ and 40¢ where entropy is high but resolution is low.
I'm use for copytrade bots: https://t.co/SIQ0s6xluv
That means: high uncertainty, but the crowd hasn't done its homework.
I built a screener around this.
R = RES / U
R is entropy efficiency. RES is how much uncertainty the market has resolved. U is the total uncertainty from base rates.
R ≈ 0 → the market is asleep. Nobody's processing information.
R ≈ 1 → the market already knows. You're too late.
I scan for R < 0.3 on markets with external signal.
Last week found one. Fed meeting odds sitting at 35¢. R = 0.18. Market was barely awake.
My model said 58%. Entropy gap:
D_KL(mine ‖ market) = Σ pᵢ · log(pᵢ / mᵢ) = 0.117 bits
That's 0.117 bits of information the market hadn't priced in yet.
Sized with Kelly:
f* = (p × b − q) / b = 0.354
Quarter-Kelly: ~9% of bankroll. Put $4,500 in.
Market resolved YES. +$5,850 on a single position.
93% of traders stare at the price.
I stare at the entropy.
The price tells you what people believe.
The entropy tells you how much they actually know.
That's the difference.
i fed Claude 5 PhD formulas and asked him to build me a terminal
he didn't ask questions. he built MiroFish
274 agents. 4 quant formulas running live
each one doing what 87% of polymarket traders can't
every 5 seconds the terminal does this:
> scans polymarket contracts
> runs bayes update on every new signal
> calculates EV against market price
> sizes position through ¼ kelly
> checks KL-divergence across correlated markets for arbitrage
no opinions. no "i feel like YES is underpriced"
just math that PhD students publish and hedge funds lock behind NDAs
here's what happened in 14 days:
> day 2: bayes picked up OSINT chatter on iran negotiations
prior 0.31 → posterior 0.58 in three updates
bot bought YES on "ceasefire by Q3" at $0.33
kelly sized it at 6% of bankroll
contract moved to $0.61 by day 5
+$2,180
> day 6: KL-divergence flagged a gap
"candidate X wins primary" priced at $0.70
"candidate X wins general" priced at $0.48
historical base rate says general should track at ~62% of primary
bot bought general, hedged with primary
convergence hit by day 9
+$3,740
> day 9: EV scanner found a weather contract
market priced hurricane landfall at $0.22
model said 41% based on NOAA data
EV = +$0.86 per dollar risked
kelly said 11% allocation
landfall confirmed day 12
+$4,890
> day 11-14: base rate engine running quiet
fed meeting contract at $0.65 for "hold rates"
base rate: fed holds when unemployment < 4% → 74% of the time
unemployment at 3.8%. market underpriced by 9 points
bought at $0.65. settled at $0.98
+$4,663
total: $15,473 in 14 days
not from predictions. from formulas
87% of polymarket wallets lose money
because they trade what feels right
the top 1.2% trade what the math says
MiroFish doesn't read twitter threads
it reads probability distributions
274 agents don't have opinions
they have bayesian priors
every 15 seconds the NEXUS core sends a pulse to all agents
they recalculate. reposition. repeat
i just watch the profit tick
copy the bot here: https://t.co/PTZuvewZE6
you don't need to be a quant
you need a quant's formulas running 24/7
Principal Component Analysis (PCA) is the gold standard in dimensionality reduction.
But PCA is hard to understand for beginners.
Let me destroy your confusion:
Esta os va a gustar. La mayoría de screeners gratuitos son limitados. Os he preparado una interfaz para desarrollar los vuestros con datos actualizados, +150 filtros (Fundamentales, Momentum, Técnico...) para el mercado americano ≈5500 empresas. Código abierto y db en el repo.
Os he incluido también los clásicos: Greenblat, CANSLIM, Hyper-Growth, Quality compounders... cerca de 20. Podéis tomarlos de referencia y modificarlos.
Probadlo que vale mucho la pena.
➡️ https://t.co/kxfup1wfMq