Most people jump straight into Machine Learning…
without understanding the math behind it.
That’s why ML feels like magic instead of logic.
This playlist fixes that 👇
https://t.co/dAWXGYWlZO
What you’ll actually learn:
• Linear Algebra → vectors, matrices, transformations
• Calculus → gradients & optimization
• Probability → uncertainty & distributions
• Hands-on exercises to build intuition
This is the math used in:
Neural Networks
LLMs
Deep Learning
Best part?
It’s explained visually and intuitively.
No heavy theory.
Only the math ML engineers truly need.
If you want to go beyond copy-paste tutorials and really understand ML:
Learn the math. Everything becomes easier.
Repost to help someone starting ML ♻️
Follow for more AI & ML resources 🚀
@zotero@LitmapsApp Science is made by people and published by people.
To really polish your understanding of the field, get to know these.
This tweet we discovered papers with @LitmapsApp (Step 3).
Let's start there and analyze their authors and journals!
https://t.co/bF02tkFWzG
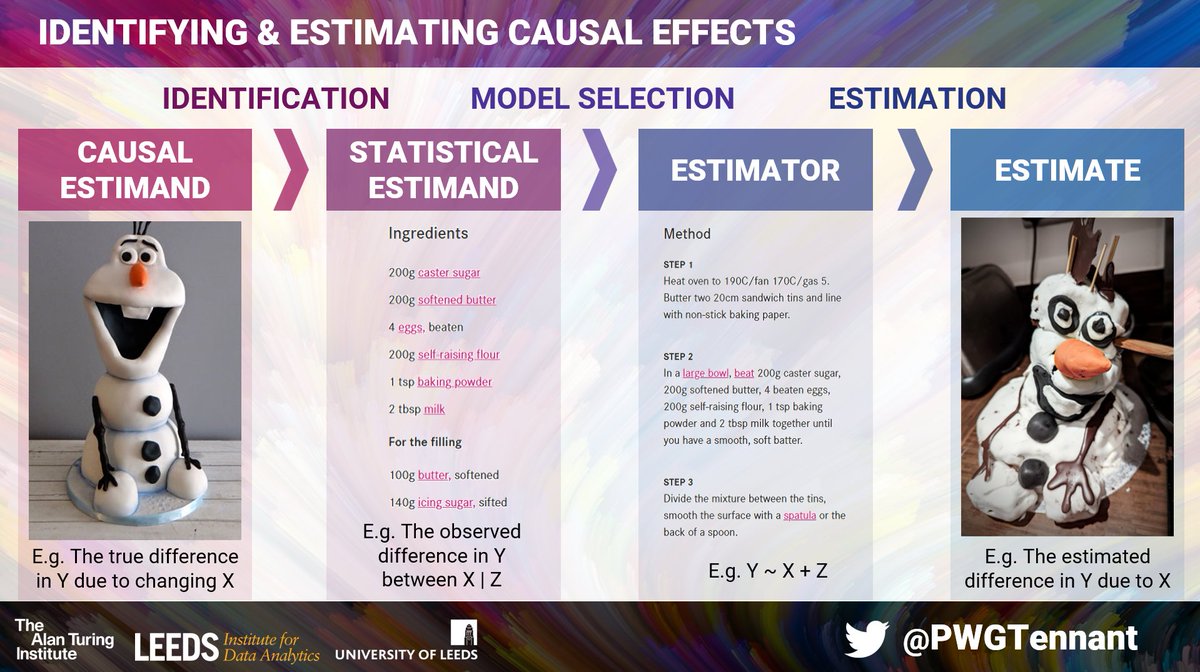
Updated slide on identifying & estimating causal effects
Causal estimand = cake you want to bake
Statistical estimand = ingredients required to bake cake
Estimator = recipe & equipment used to bake cake
Estimate = the final product!
Comments welcome!
#EpiTwitter#CausalTwitter
Interactive plots let users focus on what matters to them.
That's why they are a popular choice for data visualization.
You can make any ggplot interactive in just a few easy steps. #rstats
Time series forecasting.
Not only do 90% of data scientists struggle with it.
But 99% don't know how to automate it for their business.
So let's fix that. 🧵
#datascience
📢Call for applications!
TDR Clinical Research Leadership fellowship programme
- train and develop new research skills on poverty related infectious diseases #COVID-19 #Ebola#HIV/AIDS #tuberculosis#malaria#NTDs
🗓️Due: 15 March
👇https://t.co/lLU0jFLvjL
#call#leaders
I am teaching model building/ variable selection using DAGs in my regression course.
I'd love to provide a few different real-world examples of the consequence of conditioning on a collider. Does anyone have a favorite teaching example? #epitwitter#statstwitter
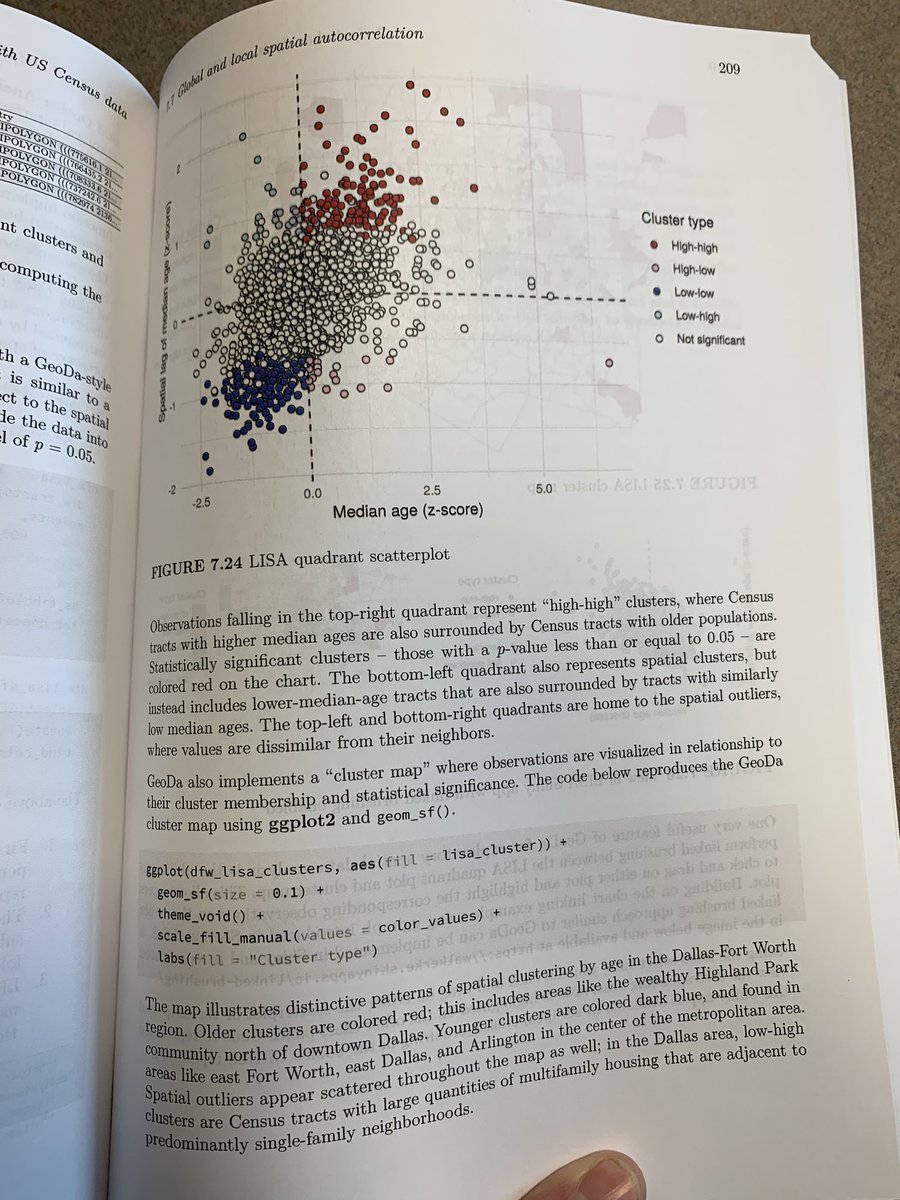
My book Analyzing US Census Data is now in print! I’m really happy with how it turned out.
Thanks so much to @lara_crc and the @CRCPress team. You can order your copy today! https://t.co/6F32TSlyT2; https://t.co/zdG0wmqN60
#rstats
For 2 years I have worked on this #rstats resource. It's a collection of functions used to wrangle data, especially in the field of ed research. Functions are organized by task (such as naming variables), and examples of how to use functions are provided.
https://t.co/DHDjIKAXUk
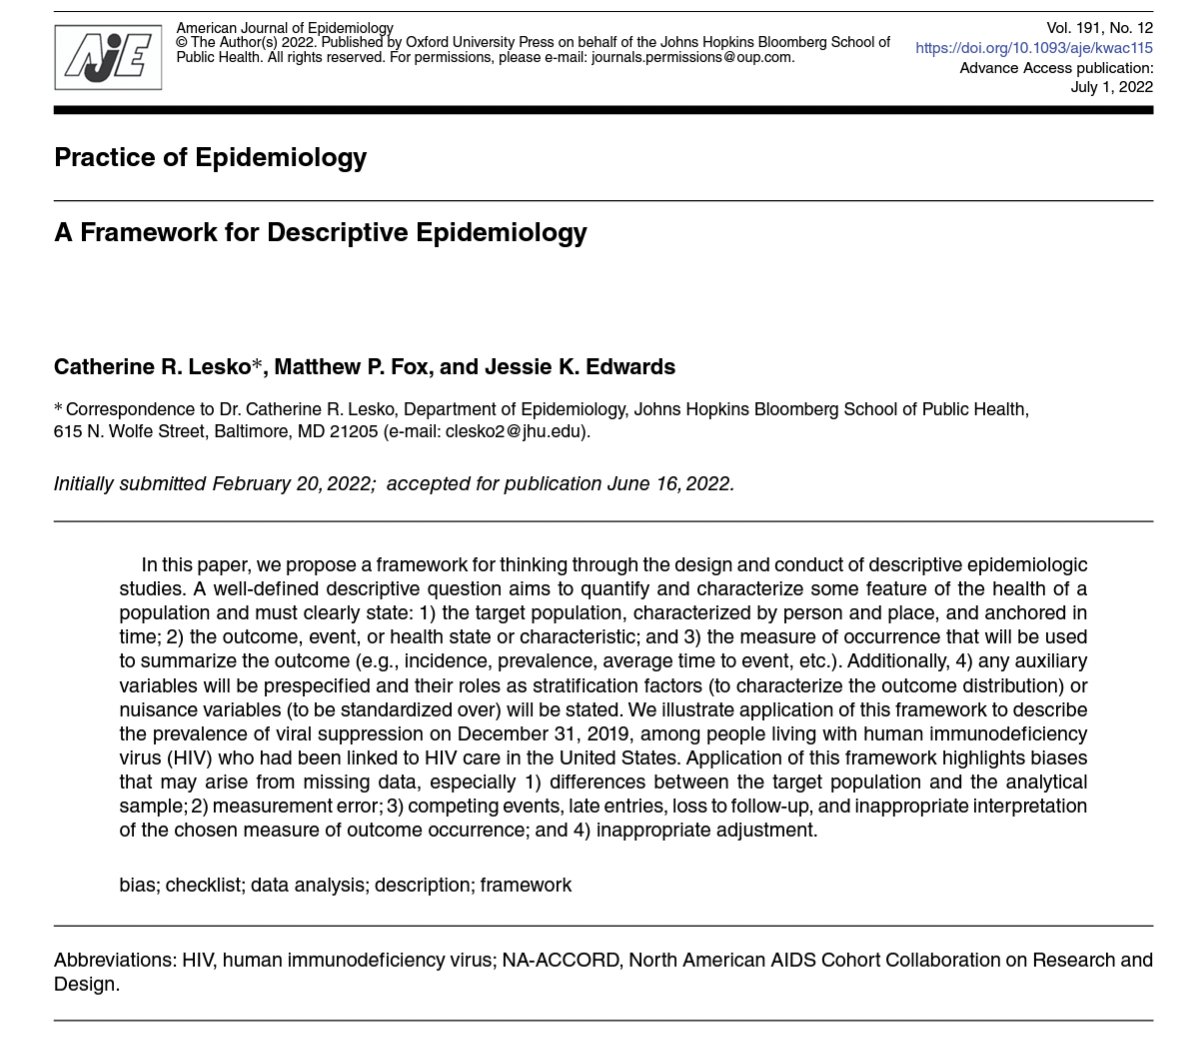
#3: Descriptive epidemiology may the most undervalued field of epidemiology. This paper explains nicely how to do it well
Open access 👉 https://t.co/JIYps9rPkR