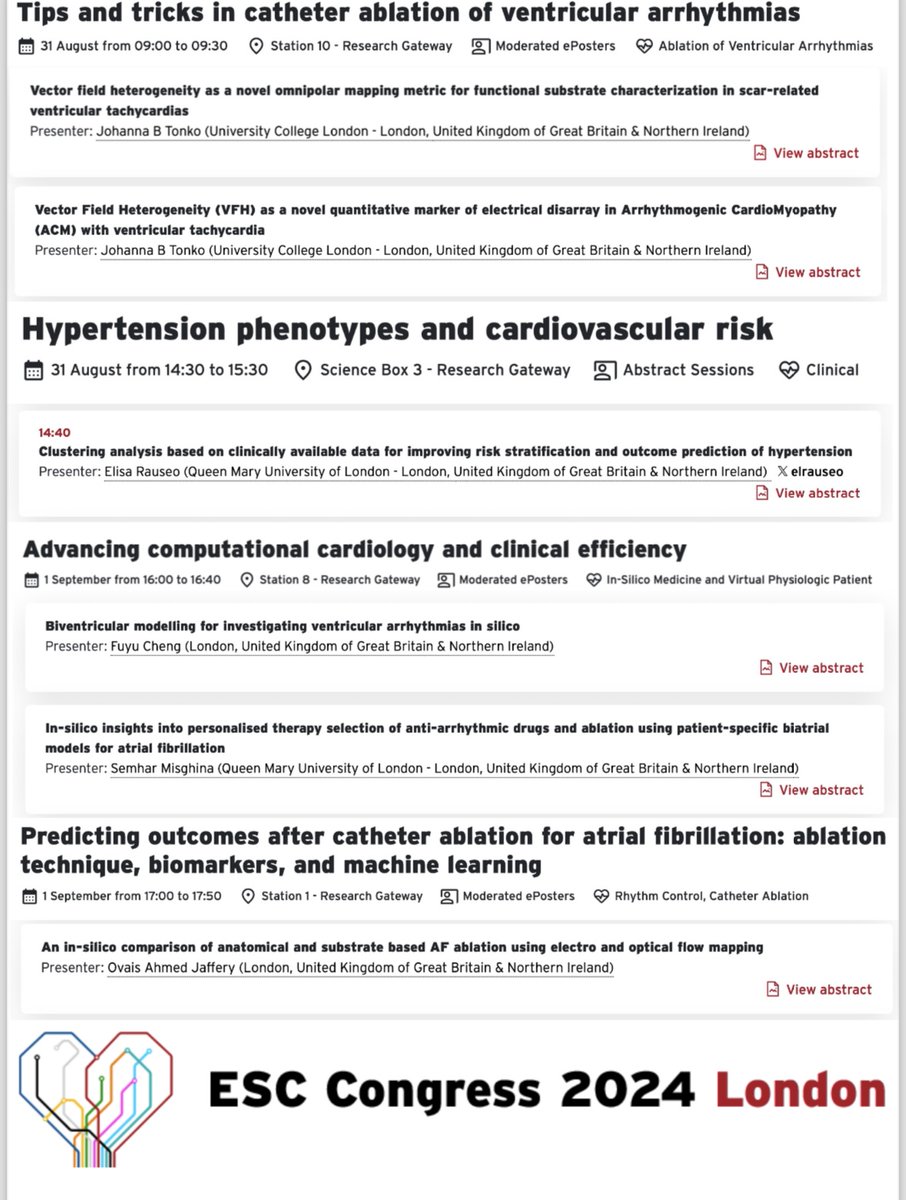
Great to join today the US Market Access event hosted by SEHTA, MentorOhio, and the London Institute for Healthcare Engineering (LIHE).
Inspiring conversations & global collaboration in digital health!
#DigitalHealth#AIinHealthcare#Cardiology#MedTech
As shared by Andreas Horn -> Head of AIOps @IBM (LinkedIn)
𝗧𝗵𝗶𝘀 𝗶𝘀 𝗵𝗮𝗻𝗱𝘀-𝗱𝗼𝘄𝗻 𝘁𝗵𝗲 𝗕𝗘𝗦𝗧 𝗮𝗻𝗱 𝗦𝗜𝗠𝗣𝗟𝗘𝗦𝗧 𝗲𝘅𝗽𝗹𝗮𝗻𝗮𝘁𝗶𝗼𝗻 𝗼𝗳 𝗱𝗮𝘁𝗮 𝗽𝗶𝗽𝗲𝗹𝗶𝗻𝗲𝘀 𝘆𝗼𝘂'𝗹𝗹 𝗲𝘃𝗲𝗿 𝘀𝗲𝗲! ⬇️
In today’s AI-driven world, robust data pipelines aren't just a necessity — they're the FUEL that powers everything. ⛽ Without them, AI is just a fancy idea with no real impact.
Data pipelines are the backbone of modern data-driven businesses. And they automate the process of collecting, organizing, and transforming data.
...𝗕𝘂𝘁 𝗯𝘂𝗶𝗹𝗱𝗶𝗻𝗴 𝗮𝗻 𝗲𝗳𝗳𝗲𝗰𝘁𝗶𝘃𝗲 𝗱𝗮𝘁𝗮 𝗽𝗶𝗽𝗲𝗹𝗶𝗻𝗲 𝗶𝘀 𝗾𝘂𝗶𝘁𝗲 𝗵𝗮𝗿𝗱!
Here are the key stages to consider:
1️⃣ 𝗗𝗮𝘁𝗮 𝗦𝗼𝘂𝗿𝗰𝗲𝘀: Collect raw data from various sources.
2️⃣ 𝗗𝗮𝘁𝗮 𝗟𝗼𝗮𝗱𝗲𝗿𝘀: Ingesting the right and trusted data.
3️⃣ 𝗗𝗮𝘁𝗮 𝗟𝗮𝗸𝗲: Store the raw data in a highly accessible format.
4️⃣ 𝗣𝗿𝗲𝗽𝗮𝗿𝗮𝘁𝗶𝗼𝗻/𝗖𝗼𝗺𝗽𝘂𝘁𝗮𝘁𝗶𝗼𝗻: Process and transform the data.
5️⃣ 𝗗𝗮𝘁𝗮 𝗪𝗮𝗿𝗲𝗵𝗼𝘂𝘀𝗲: Store the processed data for specific purposes.
6️⃣ 𝗗𝗮����𝗮 𝗦𝗵𝗮𝗿𝗶𝗻𝗴: Make the data available for analysis and decision-making.
#AI #GenAI #ResponsibleAI #startup #technology #ArtificialIntelligence #automation #chatgpt4 #OpenAIChatGPT #data #healthtech #IoT #technology #5G #telehealth #digitalhealth #mhealth #startups #OpenAI #HealthIT #ChatGPT账号 #WearableTech #DataScience #AI #MachineLearning #dataprotection #DataPrivacy #databreach
@danfiehn @bimedotcom @chidambara09 @RLDI_Lamy @JagersbergKnut @BetaMoroney
@EstelaMandela @GlenGilmore @CurieuxExplorer
@enilev @ArchimedesInte2 @mikeflache @anand_narang @Nicochan33 @IanLJones98
@AlbertoEMachado @FrRonconi @SKodineya
@rafael52987 @KanezaDiane @enricomolinari
@jeancayeux @healthinovatio1 @sonu_monika
@Eli_Krumova @HITLabs10000 @Analytics_699
@SiddharthKS @sulefati7 @devaang @theomitsa
@segundoatdell @bamitav @DigitalMachina
Understanding Factor Analysis📊
1/ Introduction:
Factor Analysis is like a detective tool for researchers. Imagine you have a huge pile of data, and you suspect there are hidden patterns or themes. Factor Analysis helps you uncover these hidden themes!
2/ Why use it?:
When you have tons of data, it can be overwhelming. Factor Analysis simplifies things by grouping similar data together. It's like sorting a mixed bag of candies into their respective flavors.
3/ Basic Idea:
Think of Factor Analysis as a librarian. If you give her a stack of books, she'll sort them into categories based on their topics. In the same way, Factor Analysis groups your data based on underlying patterns.
4/ Factors vs Variables:
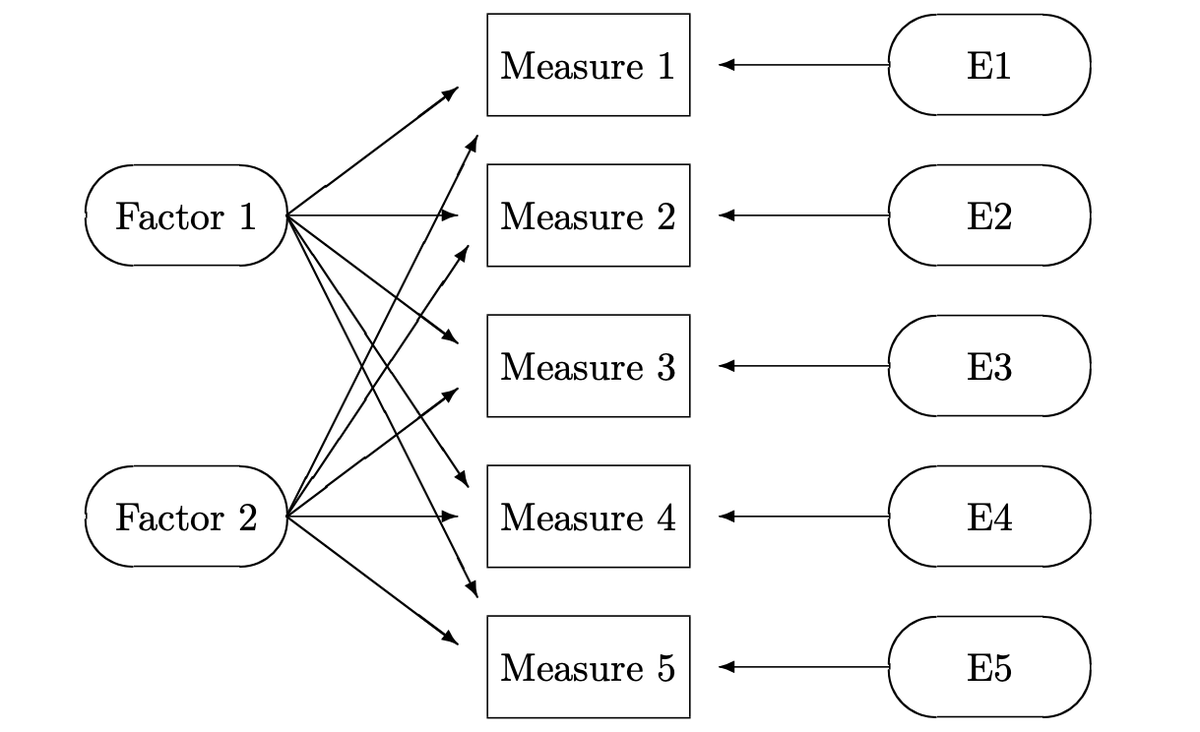
In our data, we have things we can measure directly, called "variables" (like height, weight, or test scores). But sometimes, there are hidden forces or "factors" (like health or intelligence) that influence these variables. Factor Analysis helps us find these hidden factors.
5/ Reduction:
One of the coolest things about Factor Analysis is its ability to reduce data. Instead of juggling 50 different pieces of data, it might tell you that most of them are influenced by just 3 or 4 main themes or factors.
6/ How does it work?:
Factor Analysis looks at how data points move together. If two variables (like time spent studying and test scores) often rise and fall together, they might be influenced by a common factor (like motivation).
7/ Visualization:
Imagine plotting all your data on a giant chart. Factor Analysis draws lines (or axes) that best capture the patterns in the data. These lines represent our hidden factors.
8/ Not a crystal ball:
While Factor Analysis is powerful, it doesn't "prove" anything. It suggests possible hidden factors, but it's up to researchers to interpret and validate them.
9/ Types of Factor Analysis:
Exploratory Factor Analysis (EFA): When you're not sure what you're looking for and want to explore.
Confirmatory Factor Analysis (CFA): When you have a hunch about the hidden factors and want to test your theory.
10/ Steps in Factor Analysis (oversimplified):
Collect Data: Get as much relevant data as you can.
Choose the Method: Decide on EFA or CFA based on your goals.
Run the Analysis: Use statistical software to crunch the numbers.
Interpret the Results: Identify the hidden factors and see how they relate to your data.
Validate: Check if your findings make sense and if they can be replicated.
11/ Real-world Applications:
From psychology (understanding personality traits) to finance (identifying investment themes), Factor Analysis is used in various fields to make sense of complex data.
12/ Conclusion:
Factor Analysis is like a magnifying glass for data. It doesn't give all the answers but reveals patterns and themes that can guide further research. It's a powerful tool for anyone looking to uncover the hidden stories in their data!
#DataScience #Statistics
📢Submit your research to this impactful #ResearchTopic led by our Topic Editors Alun Hughes, Henk JMM Mutsaerts, and Topic Coordinator Elisa Rauseo @elrauseo!
👉https://t.co/E0lwmo47Tc
🗓️Submit by 29 September 2023
Very good editorial today on individualized breast cancer screening with #AI in the future @radiology_rsna
https://t.co/A4YmJFEtdu
Concept reviewed
https://t.co/E5dbM4pJFX
and here
https://t.co/ofEBWUMSrZ
🆕 issue of #JACCIMG is out!
Large @UK_Biobank imaging study shows links between #IschemicHeartDisease, vascular risk factors, & accelerated brain aging ➡️ increased risk of #dementia. Brain aging to communicate brain health could promote healthier lifestyles https://t.co/7rZV5VtxJN #CardioTwitter