Are you working on infectious disease modelling in the south-west of Germany? Join us on 4 Dec for our workshop at @KITKarlsruhe: https://t.co/E4uo1PO4WB
PhD position (Karlsruhe, Germany)
Nowcasting and Short-Term Forecasting of Infectious Diseases
with @johannesbracher
at Karlsruhe Institute of Technology
More details: https://t.co/XBvlk9Yuoz
🙇 Back to work!
I'm developing 6 #dataviz projects, to simplify every step of your chart creation:
1️⃣ Pick the Right Chart
Data To Viz is your go-to decision tree: describe your dataset, and it guides you to the most suitable chart type
🌐 https://t.co/KLihruA1Xz
🧵
Just published my short book
👣 6 Steps Towards Reproducible Research 👣
on Zenodo as epub and pdf.
Feel free to reuse and cite:
Seibold, H. (2024). 6 Steps Towards Reproducible Research. Zenodo. https://t.co/K54E3jnQni
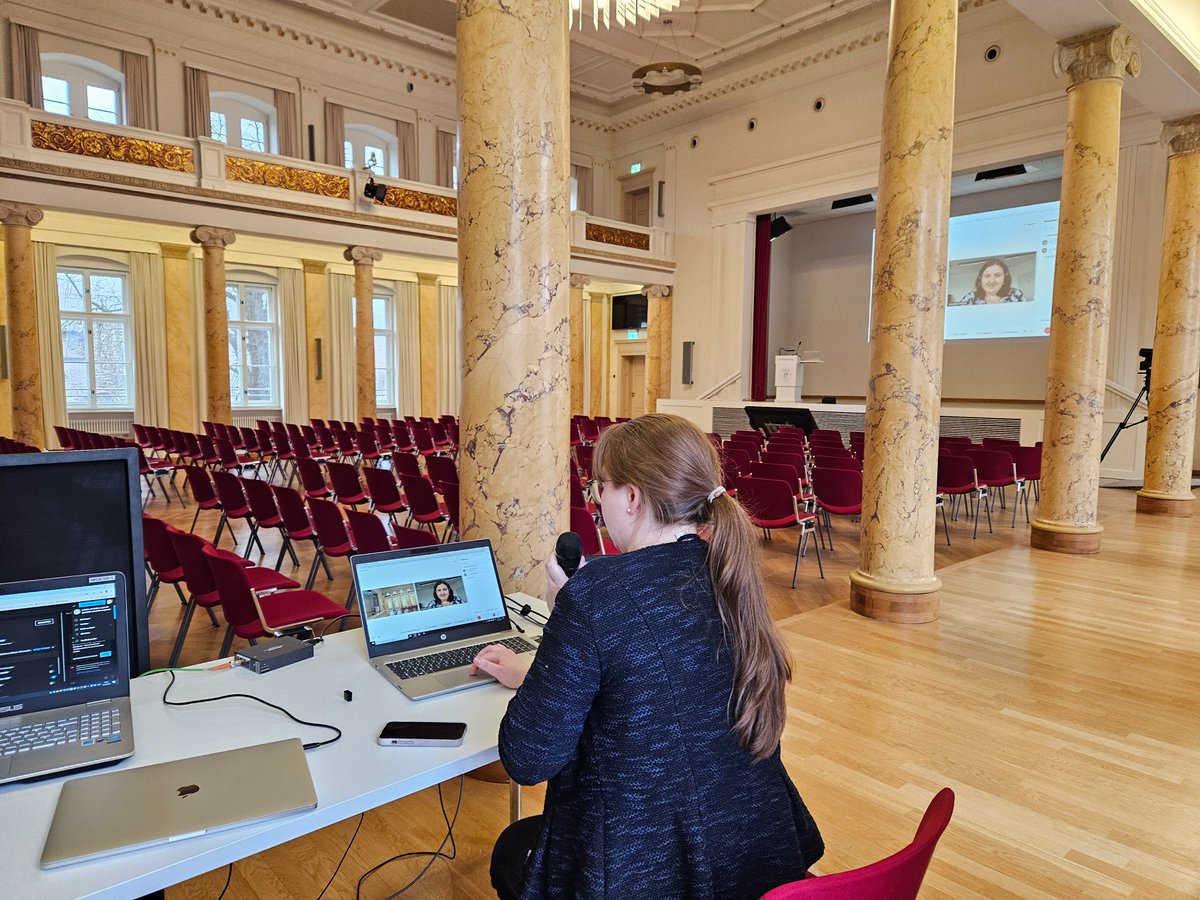
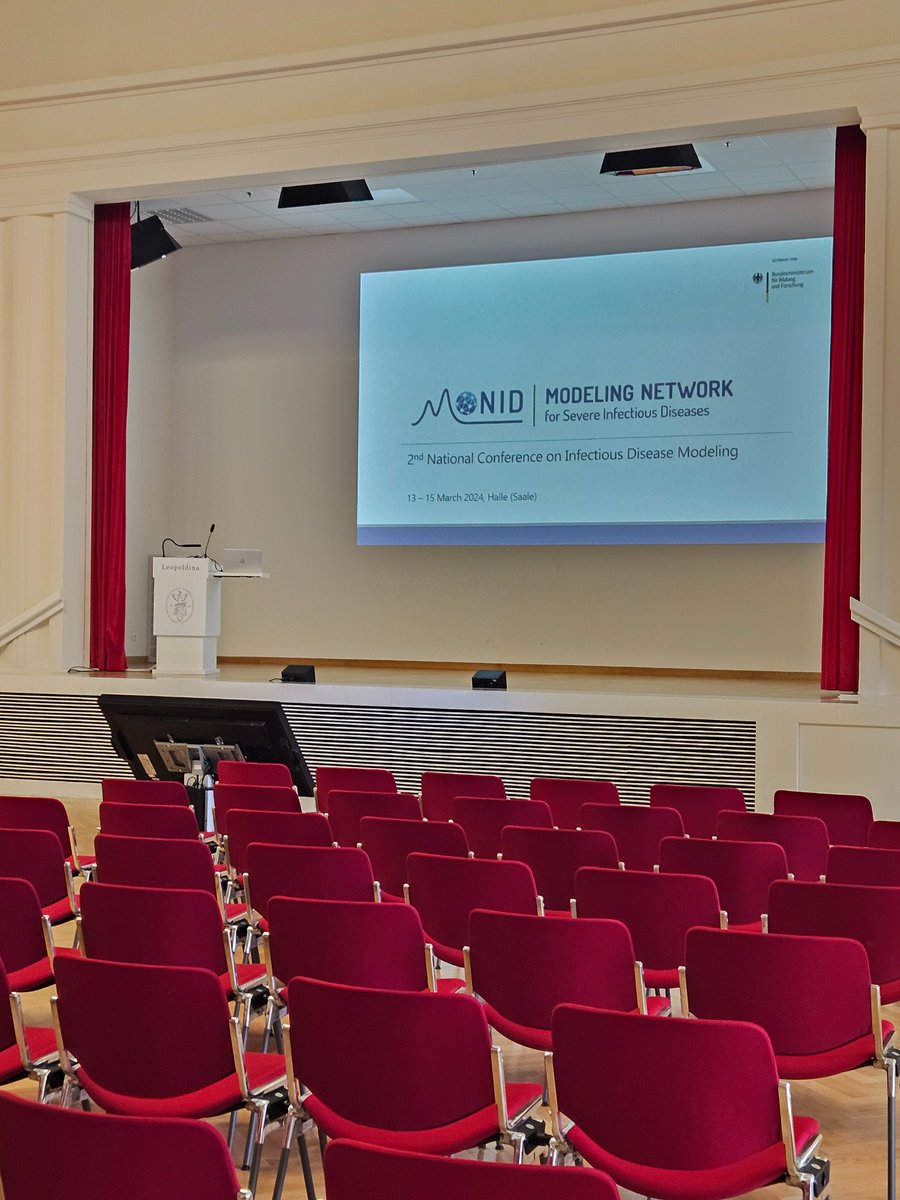
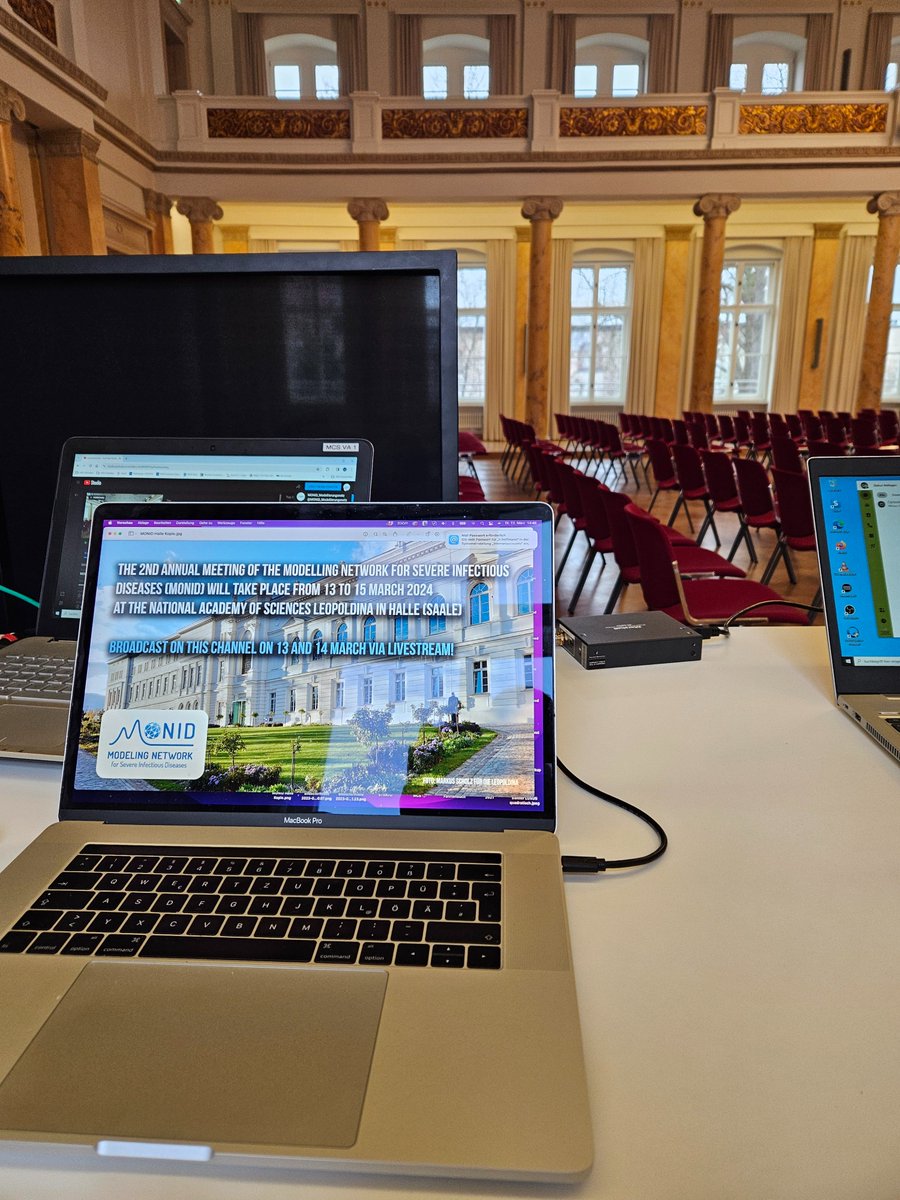
Die Vorbereitungen für die „2nd National Conference on Infectious Disease Modeling 2024″ (13. – 15.03.2024) in der Leopoldina in Halle (Saale) #MONID2024 laufen auf Hochtouren! Per Livestream am 13. & 14. März auf unserem YouTube-Kanal https://t.co/1DSwqsKUjJ
In discussions of how to improve scientific publishing (especially with regards to health emergencies), it’s worth remembering that preprint servers like @biorxivpreprint and @medrxivpreprint probably added more value to the COVID response than every big name journal combined…
🚨The R package `simulist`, to simulate individual-level outbreak and contact-tracing data, is now available to users. Whether you want to test your methods or models, or generate realistic teaching materials, check it out on the Epiverse website 👇https://t.co/PFtjA39SKu
🤧 Schnupfen, Husten, Halsschmerzen, Fieber – oder gesund: Machen Sie mit bei GrippeWeb und unterstützen Sie die Wissenschaft!
📈 #GrippeWeb ist ein digitales, partizipatives Surveillance-Instrument für akute Atemwegserkrankungen.
Jetzt anmelden
➡️ https://t.co/a5xC3hUBXO
PUBLICATION: Last year, together with the @WHO Hub for Pandemic & Epidemic Intelligence, we organized a workshop on advanced analytics to inform decision making during public health emergencies.
The report is now live! 👇https://t.co/AWYnD2V9Rt
🧵1/7
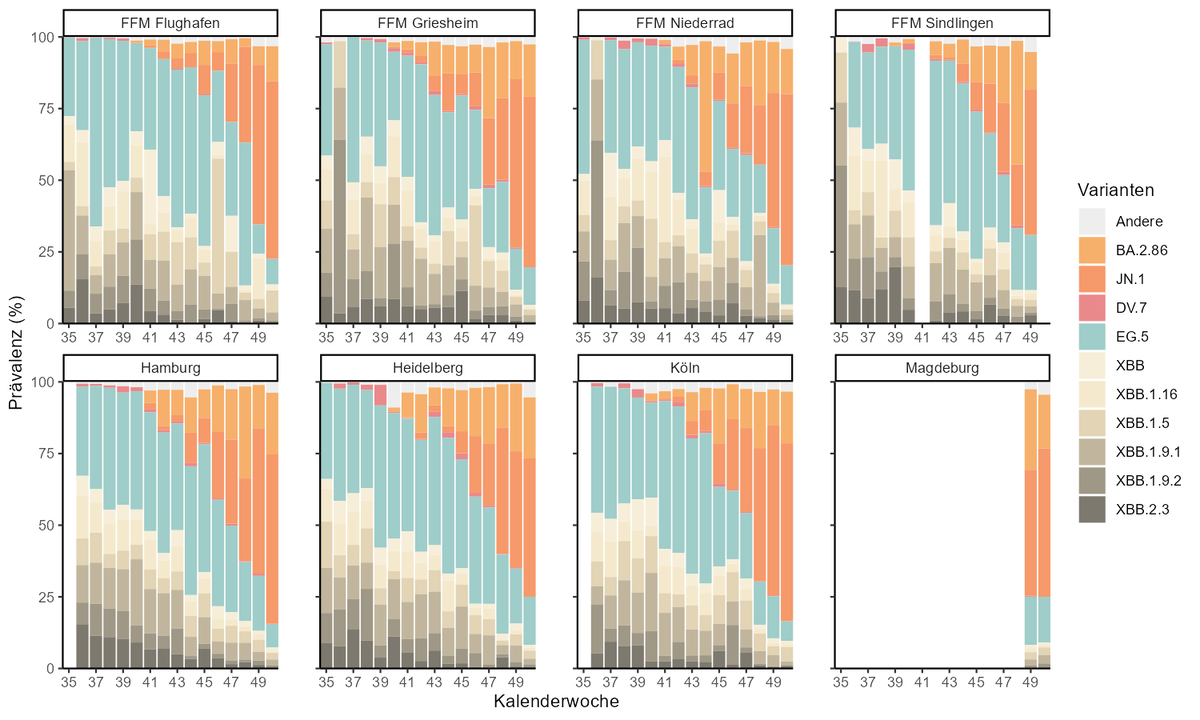
From the recent SARS-CoV-2 wastewater surveillance report for 🇩🇪: BA.2.86 and its sublineage JN.1 (declared VOI since a week) continuously increase.
Sequencing results shared from @Lackner_TUDa and team with @rki_de in the context of AMELAG - thx!
⬇️⬇️
https://t.co/t6iyoX7Y6s
“Forecasting influenza hospital admissions within English sub-regions using hierarchical generalised additive models” our new publication out today!
https://t.co/ZV7duZztP2
🔜 I’ll be recruiting a number of post-docs and Phd students to my new group in Berlin.
If interested and keen on vaccine epidemiology, global health and disease dynamics, including eg modelling, stats, RSV, Pneumo, Dengue, pandemic preparedness, please get in touch
Today, we're launching the Pathogen Harmonized Observatory, or Pharos: a global platform for managing and sharing data on wildlife disease. You can explore some example datasets, or upload your own, by heading over to https://t.co/Abf2Gu4ifJ 🖥️
More on the project... 🧵
#AMELAG baut die #Abwassersurveillance in 🇩🇪 aus, um zusätzliche Informationen über die Verbreitung von Krankheitserregern zu sammeln.
Webseite u.a. mit FAQ und Abwassersurveillance-Wochenbericht zu #SARSCoV2
➡️ https://t.co/VydgdxMMWY
Wie Abwassersurveillance funktioniert. ⬇️