Canadian.Born in India.Humble beginnings. CEO of the leading Hospitality Co. Still humble.Real Estate sales on Mallorca and avid equity markets trader.
Even Fed's initial rate cuts didn't end prior recession induced $SPX bear markets! Each time, $SPX declined a fair bit after first rate cut...
1980 + 1990 recessions not marked on this chart but same story - $SPX declined after Fed's first rate cut before bottoming out -
When I said:
“Oil below 10 USD in 2019”, people laughed.
“USD will soar” in 2020, people laughed.
“Crypto will crash” in 2021, people laughed.
Yes - and I still say Gold to 1000 USD.
And I say #Equity Bull Market Blow-off top into 2023 before largest Deflationary Bust since 1929
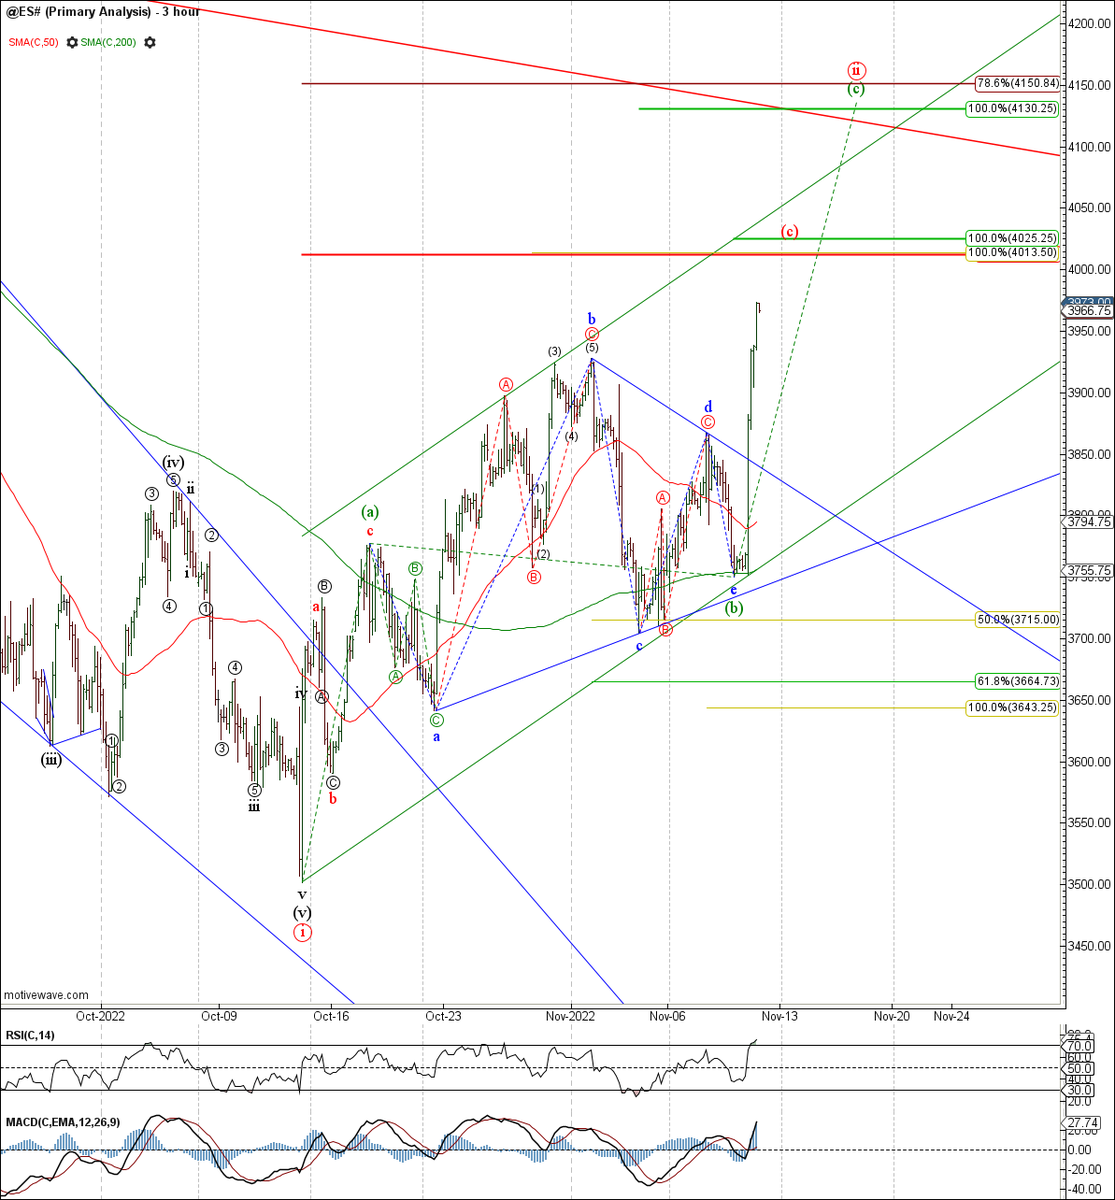
#SPX / #ES_F - That CPI lit a fire under equities and as warned with the Nasdaq chart, there was a risk of a strong rally if bears couldn't break support. Expecting this rally is a wave (c) triangle thrust targeting 4010-20, or ext higher towards the 4130-50 area.
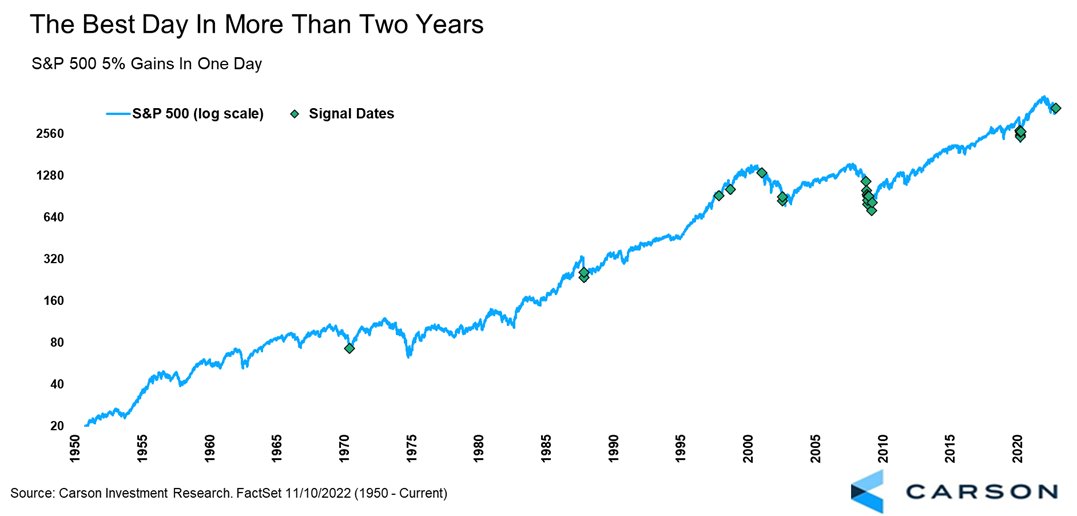
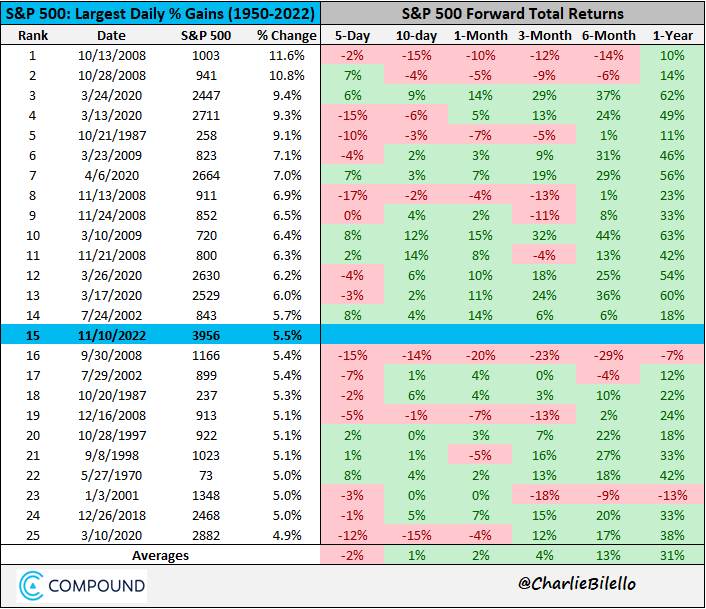
The S&P 500 gained more than 5% today, the best day since April 2020.
This was the 23rd >5% day since 1950.
Most tend to happen in clusters, but higher 27.6% a year later and up 90.9% of the time is a nice takeaway.
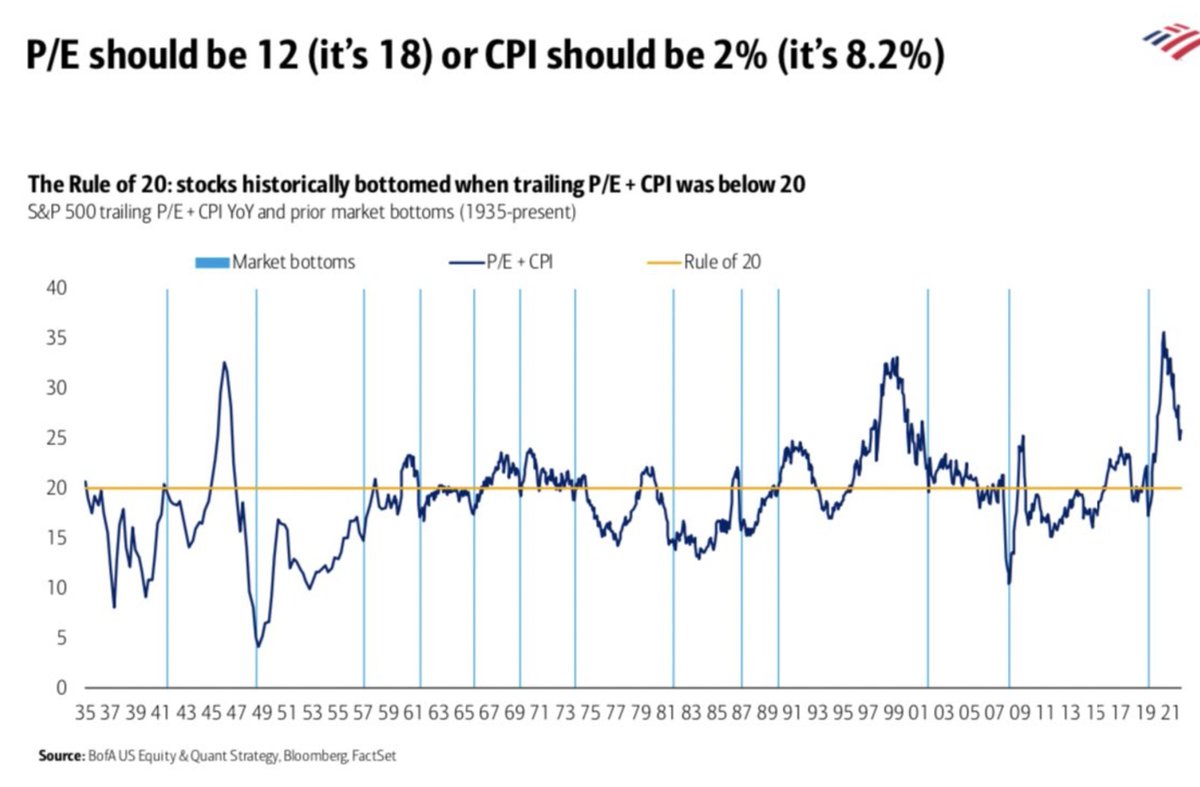
Historically, no bear market ended whilst the Fed was still raising the Fed Funds Rate.
Unless "this time is different", this bounce is a relief rally and the indices should decline to new lows.
If long dated UST yields stop rising, growth stocks likely to bottom before $SPX
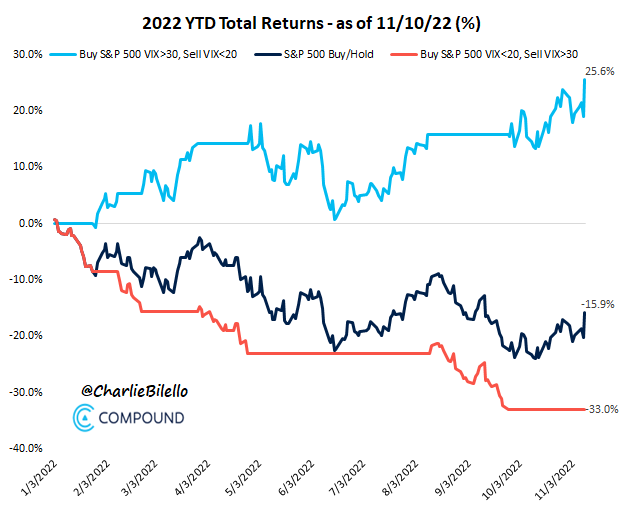
Performance of 3 strategies this year...
a) Buy S&P 500 when $VIX closes above 30, sell when $VIX closes below 20: +25.6%
b) Buy & Hold S&P 500: -15.9%
c) Buy S&P 500 when $VIX closes below 20, sell when $VIX closes above 30: -33.0%
$SPY While above $368.81 it is favoured to extend higher to reach 411.55 - 431.81 before sellers appear for a reaction lower. We like selling it at blue box areas when presented. #elliottwave#trading
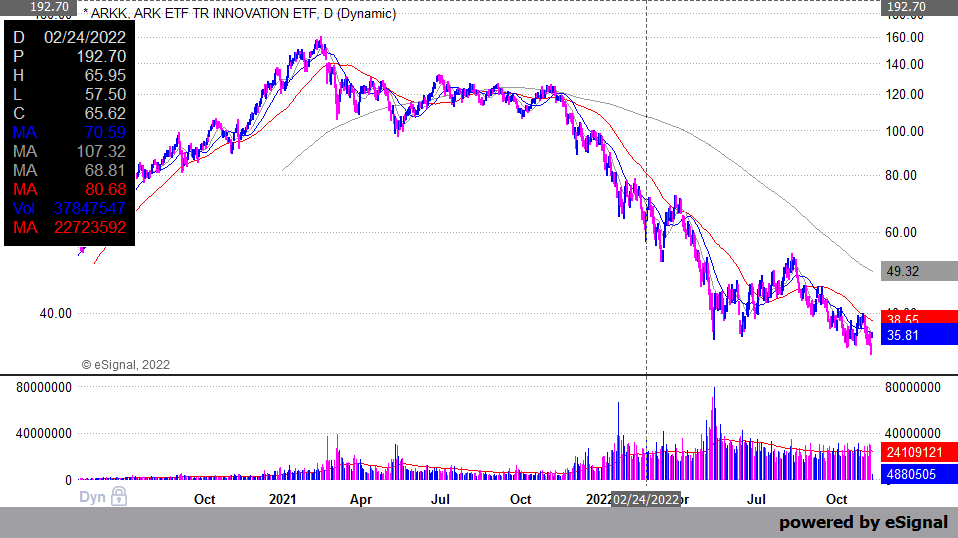
Here's the problem with holding big losses. $ARKK is up 10% this morning and it barely registers on the chart. A long way to go when you hold big losses.
The biggest market read from the Q4 senior loan officers survey is for credit. The tightening of lending standards today implies that by the middle of next year corporate credit default rates could be 8% - not the 3.5% currently discounted in the markets
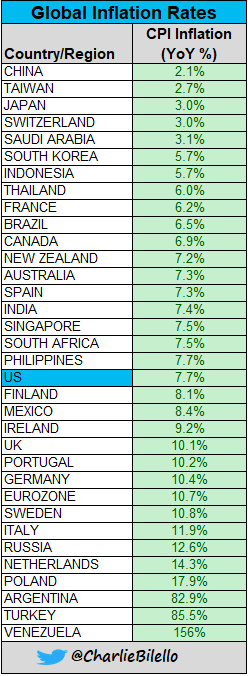
Price increases over last year (CPI report)...
Fuel Oil: +68.5%
Gas Utilities: +20.0%
Gasoline: +17.5%
Transportation: +15.2%
Electricity: +14.1%
Food at home: +12.4%
Food away from home: 8.6%
New Cars: +8.4%
Overall CPI: +7.7%
Shelter: +6.9%
Medical Care: +5.4%
Used Cars: +2.0%
Year 1: They call you stupid because you start trading.
Year 2-3-4-5: Practice 24/7, losses, failures, late nights, backtests, emotional breakdowns, new systems, risks, ideas...
Year 6: They call you lucky because you are a successful trader.
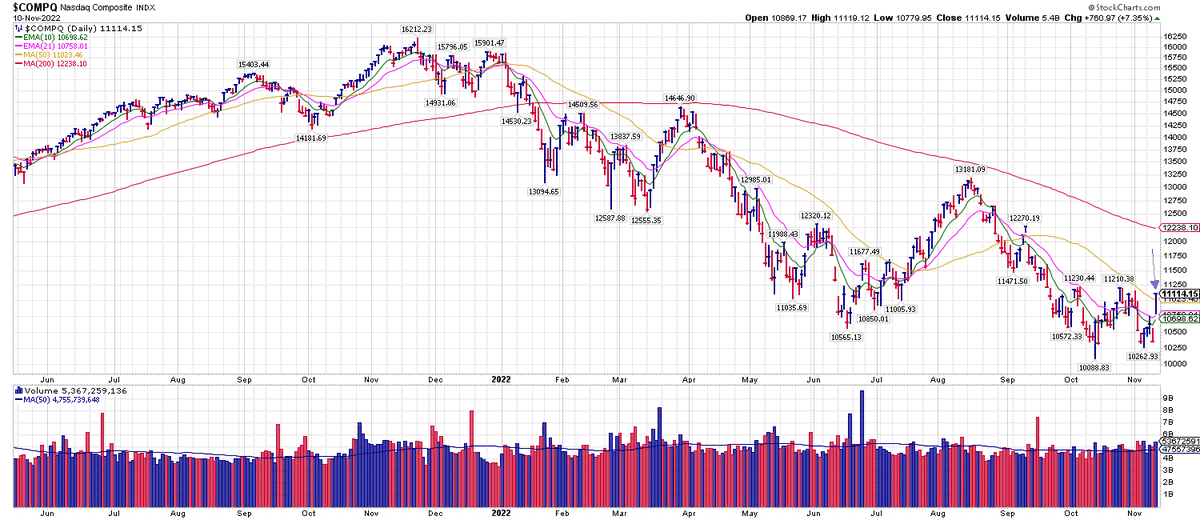
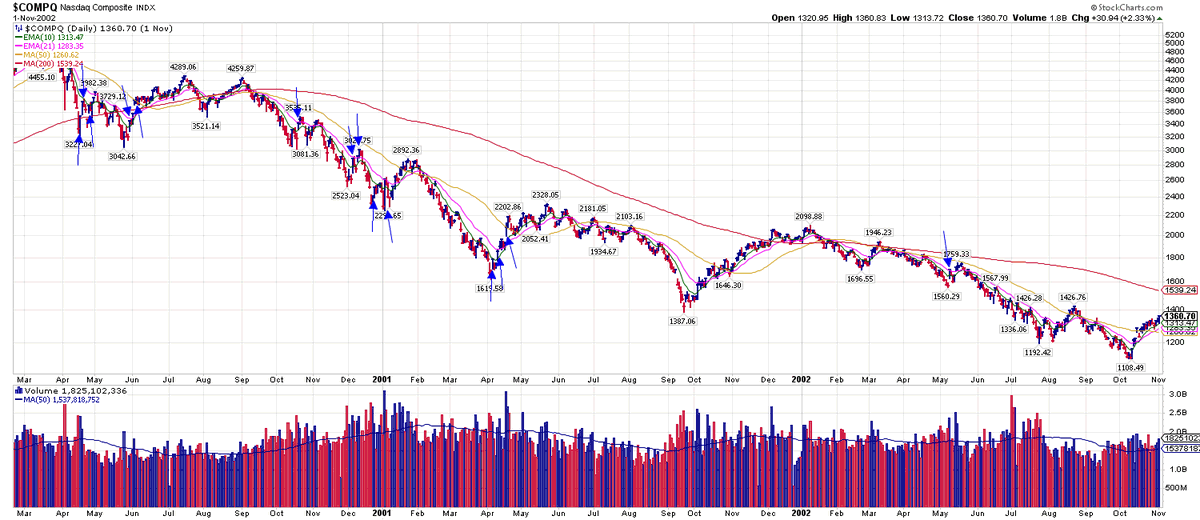
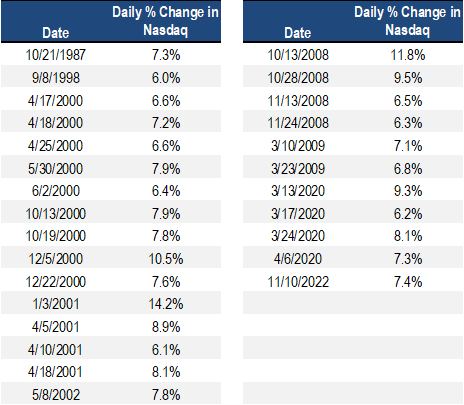
Here come the comparisons. The last two times we saw 6% gains in the Nasdaq were the ends of the 2020 and 2018 bear markets. However, it happened twice in October 2008 and that was not the bottom. Ditto May 2002, Apr 2001, Dec 2000....you get the point.
Days like today don't happen in bull markets and it is by no means a signal to pile into stocks. In 2000-2002, the Nasdaq had 14 up days of 6% or more, and you would have been wrong 14 times if you thought the bottom was in.
The S&P 500 gained 5.5% today, its largest % increase since April 2020 and 15th largest since 1950. One year later the market has often been higher following these large daily spikes (22 out of 24 times) with an average return of +31%. The 2 exceptions: Sep 2008 & Jan 2001. $SPX